
1. Moving The Markets
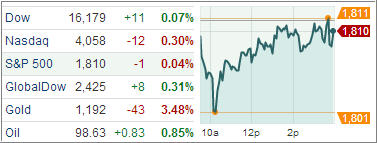
U.S. stock indexes ended up pretty much where they started on Thursday, a day after a powerful surge. It seems financial markets were still digesting the Fed’s move on Thursday. While stocks were holding close to record levels, Treasury yields climbed, the dollar rose and gold slumped to its lowest in more than three years. Apparently, investors are dumping their holdings of gold because interest rates are rising and the dollar is gaining after the Fed said it would pare back its bond purchases. Traders are selling gold because they see less risk of inflation from the Fed’s stimulus program.
Among heavily traded DJIA stocks, today’s biggest gainer was Chevron Corp. (CVX) which opened flat this morning before climbing, as investors seemed to interpret the improving economic news as leading to more demand for energy.
Meanwhile, in the ETF world, several funds stole the show and saw huge moves following the tapering announcement: Homebuilder ETFs, Gold Mining ETFs and Volatility ETFs. In particular, the SPDR S&P Homebuilders ETF and the iShares US Home Construction ETF posted big gains; the Market Vectors Gold Mining ETF and Market Vectors Junior Gold Miners ETF both rallied; and the iPath S&P 500 VIX Short Term Futures ETN slid by more than 5%.
Our ETFs in the Spotlight moved pretty much sideways and came off their yearly highs by a small margin:
2. ETFs in the Spotlight
In case you missed the announcement and description of this section, you can read it here again.
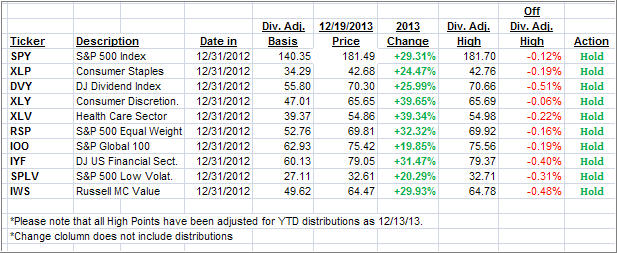
It features 10 broadly diversified ETFs from my HighVolume list as posted every Monday. Furthermore, they are screened for the lowest MaxDD% number meaning they have been showing better resistance to temporary sell offs than all others over the past year.
In other words, none of them ever triggered their 7.5% sell stop level during this time period, which included a variety of severe market pullbacks but no move into outright bear market territory.
Here are the 10 candidates:
All of them are in “buy” mode meaning their prices are above their respective long term trend lines by the percentage indicated (%M/A).
Now let’s look at the MaxDD% column and review the ETF with the lowest drawdown as an example. As you can see, that would be XLY with the lowest MaxDD% number of -5.73%, which occurred on 11/15/2012.
The recent sell off in the month of June did not affect XLY at all as its “worst” MaxDD% of -5.73% still stands since the November 2012 sell off.
A quick glance at the last column showing the date of occurrences confirms that five of these ETFs had their worst drawdown in November 2012, while the other five were affected by the June 2013 swoon, however, none of them dipped below their -7.5% sell stop.
Year to date, here’s how the above candidates have fared so far:
3. Domestic Trend Tracking Indexes (TTIs)
Trend wise, our Trend Tracking Indexes (TTIs) joined today’s Fed sponsored rally and headed further into bullish territory:
Domestic TTI: +3.97% (last close +4.24%)
International TTI: +5.64% (last close +5.55%)
Disclosure: I am obliged to inform you that I, as well as advisory clients of mine, own some of these listed ETFs. Furthermore, they do not represent a specific investment recommendation for you, they merely show which ETFs from the universe I track are falling within the guidelines specified.
Contact Ulli
Comments 2
GDX and GDXJ did not rally today. They were down 1.73 and 2.88% respectively.
Peter,
You are correct; I was looking at too many different reports, so that was my error….
Ulli…