
1. Moving The Markets
As an imminent QE wind-down is allegedly likely, Fed officials are beginning to take more seriously the proposal of a cut to the rate paid on excess reserves. The interest rate the Fed pays on excess reserves currently sits at 25 basis points. Stocks of major U.S. banks were very strong on Thursday, after the Senate Banking Committee approved Janet Yellen’s nomination to succeed Ben Bernanke as the next chair of the Federal Reserve.
An interesting development in the cell phone world today, as the nation’s top telecom regulator will propose allowing passengers to make cell phone calls and use their data plans while on an airplane, officials said Thursday. The proposed rule change by the Federal Communications Commission would allow phone use once a plane reaches 10,000 feet. Restrictions would still be in place during takeoffs and landings. This could lead to a large incentive for telecom and data providers to ramp up their in-flight operations and service offerings.
In ETF news, Bosera Asset Management, one of the longest-established fund management companies in China, has launched the first ever exchange-traded fund (ETF) listed in Mainland China to be linked to the S&P 500 Index. The new fund is Bosera’s fifth ETF and its first to offer exposure to non-China markets. By offering access to an overseas market, the launch represents a material acceleration of the development and sophistication of the ETF market in Mainland China. It will be interesting to see how enticed investors will be to take a bite of this western delicacy in the Chinese market.
Let’s review our ETFs in the spotlight:
2. ETFs in the Spotlight
In case you missed the announcement and description of this section, you can read it here again.
It features 10 broadly diversified ETFs from my HighVolume list as posted every Monday. Furthermore, they are screened for the lowest MaxDD% number meaning they have been showing better resistance to temporary sell offs than all others over the past year.
In other words, all of them never triggered their 7.5% sell stop level during this time period, which included a variety of severe market pullbacks but no move into outright bear market territory.
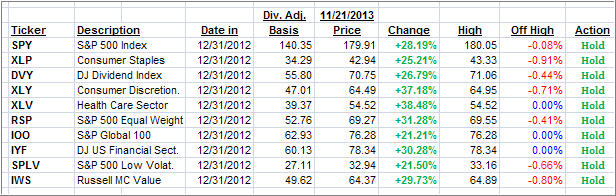
Here are the 10 candidates:

All of them are in “buy” mode meaning their prices are above their respective long term trend lines by the percentage indicated (%M/A).
Now let’s look at the MaxDD% column and review the ETF with the lowest drawdown as an example. As you can see, that would be XLY with the lowest MaxDD% number of -5.73%, which occurred on 11/15/2012.
The recent sell off in the month of June did not affect XLY at all as its “worst” MaxDD% of -5.73% still stands since the November 2012 sell off.
A quick glance at the last column showing the date of occurrences confirms that five of these ETFs had their worst drawdown in November 2012, while the other five were affected by the June 2013 swoon, however, none of them dipped below their -7.5% sell stop.
Year to date, here’s how the above candidates have fared so far:
3. Domestic Trend Tracking Indexes (TTIs)
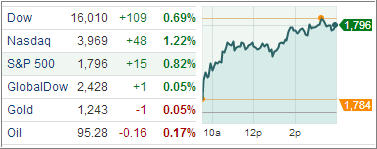
Our Trend Tracking Indexes (TTIs) rebounded with the indexes and closed the day as follows:
Domestic TTI: +4.67% (previous +4.13%)
International TTI: +7.24% (previous +6.95%)
Disclosure: I am obliged to inform you that I, as well as advisory clients of mine, own some of these listed ETFs. Furthermore, they do not represent a specific investment recommendation for you, they merely show which ETFs from the universe I track are falling within the guidelines specified.
Contact Ulli