
ETF/No Load Fund Tracker StatSheet
————————————————————-
THE LINK TO OUR CURRENT ETF/MUTUAL FUND STATSHEET IS:
————————————————————
Market Commentary
Friday, November 15, 2013
EQUITIES TREND HIGHER, EMPLOYMENT EXPECTED TO SIT STILL
1. Moving The Markets
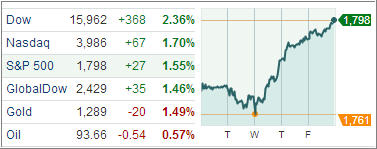
U.S. stocks climbed again, with the Dow industrials and S&P 500 knocking out a sixth week of record-clearing gains, as investors embraced the notion of continued stimulus from the Federal Reserve. Oil fell for a sixth week, its longest such stretch since December of 1998. Oil is trading at $81.30 a barrel on Friday afternoon. The dollar edged lower against the currencies of major U.S. trading partners, while the 10-year Treasury note yield used in figuring mortgage rates and consumer loans rose 1 basis point to 2.70 percent.
Heading towards 2014, the unemployment dilemma remains persistent. Although we have seen a surprising pickup in U.S. jobs growth in October, unemployment is expected to remain above 9 percent next year. On the flip side, there has been some positive economic data including ISM survey and a better than expected advance in third-quarter GDP numbers.
Quantitative Easing ‘QE’ tapering has been causing quite a ruckus in the REIT sector. Now that the U.S. economy has grown 2.8% in the third quarter, the possibility of the Fed’s QE taper came into the picture again.
While securities in this space boast some of the highest yields in the equity market, these firms are typically highly leveraged and more vulnerable to interest fluctuations than most in the REIT world. Given this, you should be at least a little concerned about the current state of the REIT ETF market. These funds might be interesting short-candidates (or at least funds to avoid) for those who believe a taper is coming, or a solid contrarian play for investors who think that a reduction in QE isn’t coming anytime soon; however, it’s best to let the long-term trend be your friend.
Speaking of friends, let’s look at our ETFs in the spotlight:
2. ETFs in the Spotlight
In case you missed the announcement and description of this section, you can read it here again.
It features 10 broadly diversified ETFs from my HighVolume list as posted every Monday. Furthermore, they are screened for the lowest MaxDD% number meaning they have been showing better resistance to temporary sell offs than all others over the past year.
In other words, all of them never triggered their 7.5% sell stop level during this time period, which included a variety of severe market pullbacks but no move into outright bear market territory.
Here are the 10 candidates:
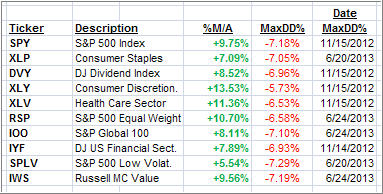
All of them are in “buy” mode meaning their prices are above their respective long term trend lines by the percentage indicated (%M/A).
Now let’s look at the MaxDD% column and review the ETF with the lowest drawdown as an example. As you can see, that would be XLY with the lowest MaxDD% number of -5.73%, which occurred on 11/15/2012.
The recent sell off in the month of June did not affect XLY at all as its “worst” MaxDD% of -5.73% still stands since the November 2012 sell off.
A quick glance at the last column showing the date of occurrences confirms that five of these ETFs had their worst drawdown in November 2012, while the other five were affected by the June 2013 swoon, however, none of them dipped below their -7.5% sell stop.
Year to date, here’s how the above candidates have fared so far:
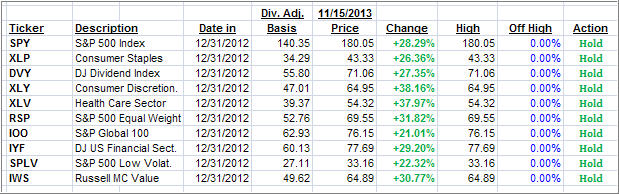
With the positive tone in the market, all 10 ETFs have made new highs represented by the 0.00% value in the “Off High” column.
3. Domestic Trend Tracking Indexes (TTIs)
Trend wise, our Trend Tracking Indexes (TTIs) rallied with the markets and remain above their long term trend lines by the following percentages:
Domestic TTI: +4.79% (last week +3.98%)
International TTI: +7.59% (last week +6.48%)
Have a great week.
Ulli…
Disclosure: I am obliged to inform you that I, as well as advisory clients of mine, own some of these listed ETFs. Furthermore, they do not represent a specific investment recommendation for you, they merely show which ETFs from the universe I track are falling within the guidelines specified.
————————————————————-
READER Q & A FOR THE WEEK
All Reader Q & A’s are listed at our web site!
Check it out at:
http://www.successful-investment.com/q&a.php
A note from reader Ian:
Q: Ulli: I’m wondering why the international TTI is still 6.57% above its trend line when VWO is well below its 200 day SMA and in a significant downward spiral. Please see the chart at this link:
http://stockcharts.com/h-sc/ui?s=VWO&p=D&yr=0&mn=6&dy=0&id=p74340931489
Thanks for your clarification on this.
A: Ian: The International TTI is a representation of “broadly diversified international funds/ETFs.” This does not include volatile country or emerging market funds. For those, you would use their own respective M/As to make your buy/sell decisions. That’s why they are listed in separate sections of the weekly StatSheet.
———————————————————-
WOULD YOU LIKE TO HAVE YOUR INVESTMENTS PROFESSIONALLY MANAGED?
Do you have the time to follow our investment plans yourself? If you are a busy professional who would like to have his portfolio managed using our methodology, please contact me directly or get more details at:
https://theetfbully.com/personal-investment-management/
———————————————————
Back issues of the ETF/No Load Fund Tracker are available on the web at:
https://theetfbully.com/newsletter-archives/
Contact Ulli