
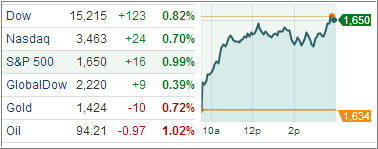
Equities got back to their winning ways, notching solid gains amid optimism that the bulls still have room to run. The Nasdaq hit its highest level since November 2000 while the Dow Jones Industrial Average and Standard & Poor’s 500 Index hit fresh all-time highs. The Dow Jones jumped 124 points (0.8%) to 15,215, the S&P 500 Index was 17 points (1.0%) higher at 1,650, and the Nasdaq Composite gained 24 points (0.7%) to 3,463.
Stocks were off to the races as financials paved the way higher when hedge-fund manager David Tepper called U.S. banks “a good sector.” Bank of America Corp. and Citigroup Inc. rose more than 2.4 percent while Goldman Sachs was the top performer with 4.89% gain. The financial sector advanced 1.7%.
Three growth-sensitive sectors also finished among the leaders despite the relative weakness across the commodity complex. Crude oil fell 1.0% to $94.20, but the energy sector rose 1.3%. Elsewhere, copper declined 2.1% to $3.289 per pound while gold shed 0.8% to $1423.70 per ounce. The basic materials sector, however, climbed 1.2%. Industrials also ended in the black as transportation-related names led the way. The Dow Jones Transportation Average jumped 1.9% to a new record high. The technology sector did not play along with other cyclical groups. Tech shares lagged throughout the day while the relative strength of biotechnology kept the Nasdag from falling too far behind the Dow and S&P.
The markets have rallied without a significant correction since the start of the year, pushing major indexes to all-time records and sending the S&P 500 up almost 16 percent for 2013 so far. The day was supported by a larger-than-expected improvement in domestic small business optimism, while a read on U.S. import prices declined. The NFIB Small Business Optimism Index rose 2.6 points in April, the most since October 2010, to 92.1, its highest level in six months.
The economy continued to expand in line with its historical average over the subsequent six months. If this historical pattern holds, it suggests the expected spring/summer slowdown in economic activity as a result of the fiscal cliff deal and sequestration could be limited. On a y/y basis, the index is off 2.5%, which is historically consistent with trend economic performance. Import prices fell 0.5% in April, its second straight decline, and in line with the consensus.
Investors will receive a full slate of economic data tomorrow. There is an increased optimism over growth in the world’s largest economy; will we see once again another day full of record breaking?
I continue to believe that stock index levels do not represent the true state of the economy. Far from it; they are actually in bubble territory and anyone investing in this environment without a clear cut exit strategy is asking for trouble.
Nevertheless, the trend is up, and we’ll stay with it as long as it lasts. Our Trend Tracking Indexes (TTIs) joined the party and reached the following positions above their long term trend lines:
Domestic TTI: +4.79%
International TTI: +9.91%
The latest ETF Model Portfolio update will be posted tomorrow morning.
Contact Ulli