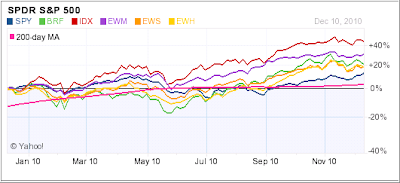
While no trend will last forever, emerging markets have been on a tear for most of this year as the 1-year chart above shows. There was a brief interruption in upward momentum when the S&P; 500 dropped over 13% during the May/June period.
More recently, since the Fed announced its Quantitative Easing (QE-2) program in early November, emerging market ETFs seem to have hit a brick wall and have retreated from their lofty levels. The 3-month chart clearly demonstrates this pullback:
At the same time, the S&P; 500 (represented by SPY in chart), has been moving upward and has made a two-year high in the process.
Bond prices have followed emerging markets down, as interest rates have risen since QE-2, which was probably one of those unintended consequences. With emerging markets and bonds heading south, I have to wonder if they are a leading indicator to a path that stocks eventually will follow.
On the other hand, this could be just a temporary blip in an ongoing bull market. Since no one can be sure about the outcome, simply use your trailing sell stops as a guide to decide when to exit any positions you hold in this arena.
My view is that we will continue to wander through a period of great uncertainty, which makes it absolutely crucial to have a workable plan in place to deal with the unexpected. It is important that you prepare for these eventualities now, so you don’t have to stress out when the market heat is on.
Disclosure: Positions in above ETFs

Comments 1
I find it interesting that you post this today, when I just sold my Vanguard Emerging Market ETF and all Intermediate Corporate bonds just last week, even before the sell stops were reached.
Of course, now the problem is trying to decide what to buy, and when.