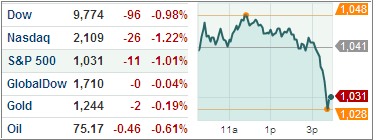
When I watched the major indexes sink into the close yesterday, I was certain that the Domestic Trend Tracking Index (TTI) had finally crossed into bear market territory.
When the final numbers were computed, we had come close but the TTI did not actually cross below the line. Here are the latest figures:
Domestic TTI value: 44.36
39-week trend line: 44.34
% above/below the line: +0.04%
The 39-week trend line will be recomputed again on Friday, so, if the markets meander around current levels, we might see a break at that time. If more downside action comes into play today, we could see a move into bear market territory later on.
Again, I like to see a clear piercing of the trend line to the downside, followed by a couple of trading days holding the level below, before accepting it as major trend change from bullish to bearish.
A potential downgrade of Spain’s credit by Moody’s sent the markets lower with the S&P; 500 breaking through the critical 1,040 support level as I discussed in yesterday’s post. Besides violating the support, the major indexes are all sporting clear head and shoulders formations, which are one of the most reliable trading patterns when it comes to directional change.
Any more bad news, especially from Friday’s jobs report, will send the indexes to much lower levels. Of course, given the amount of selling lately, there is bound to be a bounce of some sort, which will very likely to turn out to be another head fake.
If it should materialize, I would expect it to happen after the 4th of July holiday, since many traders may not want to be caught with outright long positions during these uncertain economic times over an extended weekend.
