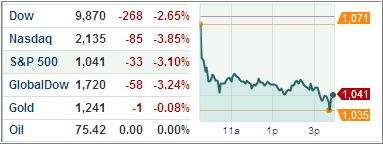
Right out of the gate, the markets hit the skids yesterday, as the above chart clearly shows.
One supporting actors in this drama causing this sharp selloff was a disappointing report on the Chinese economy as their leading indicators were downwardly revised. Adding fuel to the fire was a drop in the consumer sentiment index to the lowest level since March.
Despite a rise in U.S. home prices and a three-month extension of the home buyer tax credits, the markets were solidly entrenched in a downward move and never looked back.
Technically speaking, the S&P; 500 dropped intra-day below its strong support level of 1,040 (see chart above) but managed to close above it. If this level gets broken, you may see downside activity gain momentum.
The selloff was not enough to push our Domestic Trend Tracking Index (TTI) into bear market territory, but we are within striking distance—again. As of yesterday’s close, the TTI has moved to with +0.35% of breaking its trend line.
Any follow through selling, which is likely to happen, especially if the 1,040 level of the S&P; is violated, will end this domestic buy cycle and change our investment stance from bullish to bearish. Since you may use this break as your final exit point, I will post this event, as soon as it happens, based on the closing prices of the day.
Wall Street traders’ anxiety may very well increase somewhat over the next couple of days not only in view of yesterday’s drubbing but also because of the impending jobs report on Friday.
More uncertainty about the economy will derail this market further and life below the S&P;’s 1,040 level may very well be financially hazardous for those hanging on to outright long equity positions.

