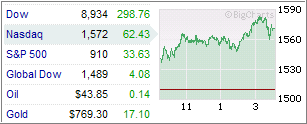
 The markets, supported by President-elect Obama’s plan to invest heavily into infrastructure, marched higher yesterday and continued their impressive short-term rebound.
Looking at the big picture, the rally over the past few days has now merely wiped out the losses sustained during the first five trading days of December. In other words, we’re still way down and have a long ways to go.
To me, it’s simply another bounce off the temporary bottom, based on hope and wishful thinking. Contributing to the rally were plans of short-term financing packages to bail out the beleaguered auto industry.
As I said in a recent post, I would not be surprised to see further temporary moves to the upside. This brings up the all encompassing question as to how high can we go and low will the next leg down be.
Mish at Global Economic Trends had some thoughts involving the Elliott Wave Theory which, according to his previous reviews, seems to be right on target. Take a look at the charts he presents on his site in respect to the S&P; 500. Here is his comment:
In Elliott Wave terms we are looking for a “wave [4]” bounce. The short term implications are bullish with possible retrace targets of 1008 for a 38.2% retrace or 1090 for a 50% retrace of “wave [3]”. The long term implications are rather nasty. Our “Wave [5]” target back down is approximately 600.
There you have it. The current bounce could be as high as 1090 with a subsequent long-term retrace target to the downside all the way to 600.
This downside target seems to agree with what others have forecast in terms of final bottom. Whether it will play out that way or not, will be revealed at some point in the future. Right now, I take this bounce for what it is and to me it’s not a major change in the trend but only bear market volatility.
