One way to evaluate if an ETF or mutual fund still has long-term upward momentum is to look at the %M/A column in my weekly StatSheet, which simply shows if a fund is above or below its trend line and by what percentage.
Many once hot sectors like energy and commodities, along with most country funds, have dropped severely and in many cases moved below their trend line into bear market territory. Some may still be hovering above it, but if you look at the DD% figures, you’ll notice a sharp drop off their highs.
Some of the Health and Biotechnology ETFs have been bucking the trend, but many are tiny in size with low volume and high spreads, and I have removed several of them from my data base. As I previously posted, you want to be in ETFs with high volume so that you can get out even if the exit doors get crowded.
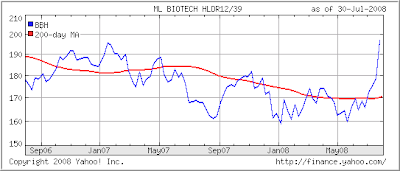
Some ETFs, like BBH, are having their own bull market right now, but having moved 18% above its trend line makes it too late to enter safely. Sometimes you have to accept that you simply missed the beginning of a trend. Take a look at BBH:
Of course, in this case, it would have taken several entries and whip-saws before you would have caught the real break-out, which many investors would not have had the stomach to do.
Look through this week’s StatSheet and notice that most momentum tables are mired in red numbers. There is a lesson in this. Don’t try to be a hero by thinking that you can pick a bottom.
We are in a bear market until the long-term trend proves otherwise. When you witness some of the rebound rallies keep in mind that “being on the sidelines and wishing you were in is preferable to being in and wishing you were out.”
