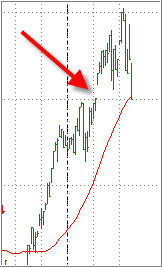
In a previous post, I had mentioned the fact that breakaway gaps, that occur on charts as a result of overly confident investing behavior, will be always be closed. That simply means a market pullback will correct prices to the downside. Here’s an enlarged version of the Trend Tracking Index (TTI) chart:
You will note that the gap (red arrow), which was created earlier in the year, has now been closed due to market weakness over the past couple of weeks. As I also pointed out at that time, this event may very well coincide with the TTI breaking through its long-term trend line, which is exactly what happened.
This puts us at a crossroads. I have seen charts, where the closing of the gap signaled a turn around in the trend back to the upside, and I’ve seen charts where heading further south was the direction of choice. In other words, no one knows for sure.
Since the TTI only broke through its trend line to the downside by -0.10% (as of 8/15/07), I will wait for further confirmation based on market activity before pulling the all-out Sell trigger and heading for the sidelines. In the meantime, I will follow my sell stop points and eliminate only those positions that have been affected.
After I wrote the above and checked today’s market, it appears that we will definitely have an all-out sell signal, unless some (unlikely) miracle turnaround pulls the major indexes out of the doldrums.
