02-17-2012

Ulli Newsletter Archives Contact

ETF/No Load Fund Tracker Newsletter For Friday, February 17, 2012

ETF/No Load Fund Tracker StatSheet

————————————————————-

THE LINK TO OUR CURRENT ETF/MUTUAL FUND STATSHEET IS:

https://theetfbully.com/2012/02/weekly-statsheet-for-the-etfno-load-fund-tracker-newsletter-updated-through-02162012/

————————————————————

Market Commentary

Friday, February 17, 2012

US STOCKS END WEEK ON A HIGH, ETFS ARE THE NEW BELLWETHERS OF THE MARKETS

US stock indexes closed higher for the week with the DJIA closing within sniffing distance of 13,000 on a solid week though investors remained wary of crucial vote on Greek on Monday.

Amid a thinly traded Friday ahead of a three-day holiday weekend, all major indexes posted healthy gains on positive economic developments and hopes of an early Greek settlement.

The DJIA closed higher with a gain of 0.35 percent, while the S&P edged up 0.2 percent but the Nasdaq closed 0.3 percent lower over yesterday. Meanwhile, a research report prepared by technology and trading firm ConvergEx Group shows that nearly $8 billion has flowed out of the US equity mutual funds while US equity ETFs have attracted approximately the same amount during the period.

A whopping $34 billion has flowed in ETFs through Feb 13, which is more than double the weekly $2.6 billion inflow recorded last year, in a sign that to know the pulse of the financial markets, it’s important to know the movements in the ETF universe.

Meanwhile global shares rose on Friday though clear differences cropped up among Greece’s paymasters over the proposed €130 billion second round of bailout payments. There was no guarantee that a decision on Greece will be reached on Monday, warned Eurogroup leaders amid reports of the German cabinet splitting up on the Greek default issue.

Traders however, remained hopeful of a settlement rather than a default which may jeopardize a fragile global recovery, pushing the French and the German indexes by 1.4 percent each.

The benchmark MSCI Index, a barometer of emerging market stocks, closed 1.2 percent higher, registering a 15 percent growth since the start of 2012.

The multitude of options being considered includes a bigger haircut for private lenders and putting part of the bailout money, equivalent to 9-12 months of government spending, in an escrow account to exert greater control over Greece’s expenses.

Investors’ risk appetite got a boost over rumors that the European Central Bank is preparing for a debt swap to push Greek maturing obligations behind. France, however, stood solidly behind Athens with Finance Minister Francois Fillon reiterating that the Europeans must honor their commitments to ensure Greece avoid a messy default.

Prices of US treasuries fell as markets remained cautiously optimistic over a Monday €130 billion Greek-deal. The single currency rose 0.2 percent against the greenback with the EUR/USD pair changing hands at 1.3162. US crude oil prices jumped to their highest level since last May to $103.2 per barrel.

Trend wise, there is no denying that we are in a bull market, as our Trend Tracking Indexes (TTIs) confirm. The Domestic TTI has moved into bullish territory by +5.39%, while its International cousin has crossed above the line by +3.88%, since that ‘Buy’ signal was issued on 2/8/12.

It’s been a strong move to the upside since the beginning of the year with hardly a correction in sight. That obviously can’t go on forever, which is why I continue to pound on the theme of you having your sell stops in place. We’re living in an environment with much uncertainty and are moving in unchartered territory in terms of global debt issues.

Be prepared to exit should the current trend hit a brick wall and shift into reverse.

Have a great week.

Ulli…

————————————————————-

READER Q & A FOR THE WEEK

All Reader Q & A’s are listed at our web site!
Check it out at:

http://www.successful-investment.com/q&a.php

A note from reader RW:

Q: Ulli: I would be interested if you could take a moment and either let me know or view a Renko chart and see how well that mirrors your proprietary trend following. You can see a free Renko Chart at:

stockcharts.com

Click the free charts tab then try sharp chart and put in a symbol such as SPY.

Then under type: select Renko chart.

You then can set up anything else you like on the chart. Renko charts just try and display trend changes only and do not take into consideration TIME or VOLUME.

I am looking at a Renko of SPY and it has the trend change (on daily charts) around Oct 5th, 2011. Since you follow a Trend Following methodology wondering if this type of charting may be more apropos as this is its design.

Since this time you as well as most of us struggled with whether it was a valid trend change or just a precursor to a whipsaw with all the events going on in Europe financial arena. Now it seems as though it’s now ran very far since Dec 19th and many of us are again late catching that train as it seems to have left the stop that is of course unless a traditional Feb has a real nice pullback.

One other question, when you take on a new customer and the market is in a middle of a trend, what methodology do you use to enter their funds. Do you wait for some pullback or since you proprietary method has an uptrend you just invest at that time?

A: RW: Interesting Renko charts. They seem to track things more on a short term basis than I do. Nevertheless, their Buy of around 10/5/11 was fairly close to our Domestic Buy effective 10/25/11…

In regards to taking on a new customer during mid-cycle, which happens all the time, I establish their risk tolerance as shown in the second video clip on my blog’s main page (below the first 2 sponsors on the right). That will determine how much I deploy. Just a couple of days ago, I set up 2 new clients in a 100% invested position; one of them in model ETF portfolio #2 and the other one in #4.

Remember, if you are working with sell stops, you can be a little more aggressive as long as it goes along with the client’s risk profile.

———————————————————-

WOULD YOU LIKE TO HAVE YOUR INVESTMENTS PROFESSIONALLY MANAGED?

Do you have the time to follow our investment plans yourself? If you are a busy professional who would like to have his portfolio managed using our methodology, please contact me directly or get more details at:

https://theetfbully.com/personal-investment-management/

———————————————————

Back issues of the ETF/No Load Fund Tracker are available on the web at:
https://theetfbully.com/newsletter-archives/

ETF/No Load Fund Tracker Newsletter For Friday, February 17, 2012

Ulli ETF Tracker Contact

ETF/No Load Fund Tracker StatSheet

————————————————————-

THE LINK TO OUR CURRENT ETF/MUTUAL FUND STATSHEET IS:

https://theetfbully.com/2012/02/weekly-statsheet-for-the-etfno-load-fund-tracker-newsletter-updated-through-02162012/

————————————————————

Market Commentary

Friday, February 17, 2012

US STOCKS END WEEK ON A HIGH, ETFS ARE THE NEW BELLWETHERS OF THE MARKETS

US stock indexes closed higher for the week with the DJIA closing within sniffing distance of 13,000 on a solid week though investors remained wary of crucial vote on Greek on Monday.

Amid a thinly traded Friday ahead of a three-day holiday weekend, all major indexes posted healthy gains on positive economic developments and hopes of an early Greek settlement.

The DJIA closed higher with a gain of 0.35 percent, while the S&P edged up 0.2 percent but the Nasdaq closed 0.3 percent lower over yesterday. Meanwhile, a research report prepared by technology and trading firm ConvergEx Group shows that nearly $8 billion has flowed out of the US equity mutual funds while US equity ETFs have attracted approximately the same amount during the period.

A whopping $34 billion has flowed in ETFs through Feb 13, which is more than double the weekly $2.6 billion inflow recorded last year, in a sign that to know the pulse of the financial markets, it’s important to know the movements in the ETF universe.

Read More

Weekly StatSheet For The ETF/No Load Fund Tracker Newsletter – Updated Through 02/16/2012

Ulli ETF StatSheet Contact

ETF/Mutual Fund Data updated through Thursday, February 16, 2012

If you are not familiar with some of the terminology used, please see the Glossary of Terms.


1. DOMESTIC EQUITY MUTUAL FUNDS/ETFs: BUY — since 10/25/2011

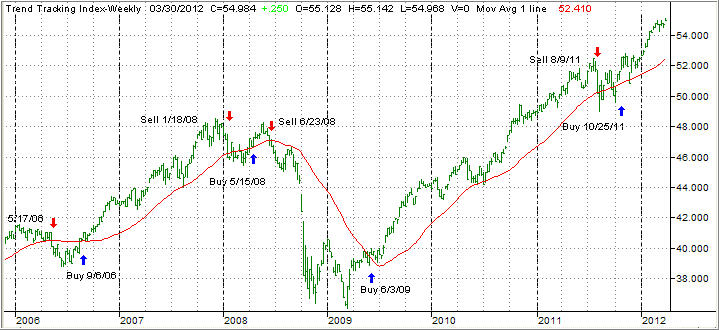
The domestic TTI broke through its long-term trend line generating a Sell for this area effective 8/9/2011. Over the recent past, we’ve seen the TTI hovering slightly below and above this dividing line between bullish and bearish territory. The clear break to the upside occurred on 10/24/11 and, effective 10/25/11, a new Buy signal for domestic equities went into effect.

As of today, our Trend Tracking Index (TTI—green line in above chart) has broken above its long term trend line (red) by +5.46%. Be sure to tune into my blog for the latest updates.

Read More

Big Turnaround For Equity ETFs

Ulli Market Review Contact

[Chart courtesy of MarketWatch.com]

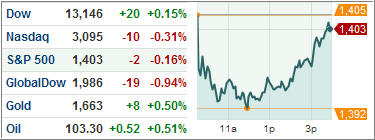
After yesterday’s dip, equity ETFs made up lost ground and then some as the S&P 500 gained 1.10%. The 10-year bond also moved back up to hit a yield of almost 2%. Overall, there have been large fluctuations in risk perception.

There was a spate of positive economic news that contributed to equity bullishness such as a 4-year low in jobless claims as well as an increase in housing starts in January.

However, the spotlight is on Greece. The Greek finance minister announced that a bailout deal could come as soon as Monday, but we’ve already heard this story before given the number of countless delays. Until a deal is finalized, I have no reason to breathe a sigh of relief.

Read More

Greek Overhang Weighs Down on Major Market ETFs

Ulli Market Review Contact

[Chart courtesy of MarketWatch.com]

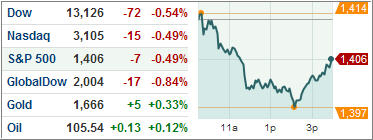
Further uncertainty in Greece sent major market ETFs into the red, with the S&P 500 falling 0.54%. Despite weakness in equities and the Euro inching back down toward $1.30/Euro, gold and oil were on the upside.

The primary catalyst for the pessimistic mood continues to be delays surrounding the Greek bailout, or lack thereof. There has been talk that EU officials are trying to come up with a way to push the bailout into April in light of Greece’s political dissension.

As if playing a game with no end in sight, I’m afraid that Europe wants to keep pushing its problems out considering the amount of difficulty in arriving at a solution. With this in mind, market risk will most probably heighten significantly in the coming days.

Read More

7 ETF Model Portfolios You Can Use – Updated through 2/14/2012

Ulli Model ETF Portfolios Contact

Momentum slowed over the past week with the S&P 500 adding only 0.3%. Will Greece receive new bailout money, or not, has been the main question as the Eurozone Finance ministers will have the final say if and when funds will be released.

Opinions abound that Greece will head for a default anyway, a view that I share, and this possibility has the markets somewhat on edge. Technically, we are due for a rebound anyway and, if that is coupled with a disorderly default, it will most likely magnify downside momentum.

Again, it’s important that you establish your exit strategy now, during times of calmness, so you don’t get stressed out when the market heat is on.

Take a look at the latest ETF Model Portfolio update:

Read More