ETF/No Load Fund Tracker Newsletter For Friday, May 4, 2012

Ulli ETF Tracker Contact

ETF/No Load Fund Tracker StatSheet

————————————————————-

THE LINK TO OUR CURRENT ETF/MUTUAL FUND STATSHEET IS:

https://theetfbully.com/2012/05/weekly-statsheet-for-the-etfno-load-fund-tracker-newsletter-updated-through-05032012/

————————————————————

Market Commentary

Friday, May 4, 2012

US EQUITIES SLUMP ON WEAK JOB DATA; VXX SOARS, USO SINKS

A market selloff sent the S&P 500 and the NASDAQ Composite to their lowest level in 2012 today after the US Labor Department report showed employers added fewer jobs in April than estimated.

Markets were further spooked over the upcoming French elections on Sunday, where incumbent president Nicholas Sarkozy faces tough challenge from socialist challenger Francois Hollande.

Treasuries advanced, hitting a fresh three-month high amid speculations that the US Fed would intervene to kick-start a slowing economy. Government debt ended on a high for the seventh week in a row, the longest stretch since 2008.

The Dow Jones Industrial Average (DJIA) dropped 1.3 percent, lower by 1.4 percent for the week. Political uncertainty in Europe added to the market frenzy as Greece goes to polls this weekend. All the 30 components of Dow closed lower for the day.
Read More

Weekly StatSheet For The ETF/No Load Fund Tracker Newsletter – Updated Through 05/03/2012

Ulli ETF StatSheet Contact

ETF/Mutual Fund Data updated through Thursday, May 3, 2012

If you are not familiar with some of the terminology used, please see the Glossary of Terms.


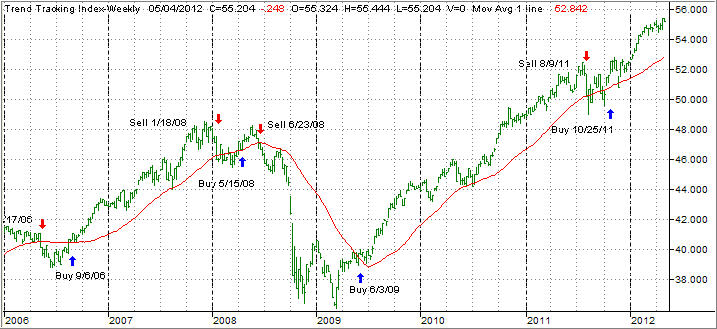
1. DOMESTIC EQUITY MUTUAL FUNDS/ETFs: BUY — since 10/25/2011

The domestic TTI broke through its long-term trend line generating a Sell for this area effective 8/9/2011. Over the recent past, we’ve seen the TTI hovering slightly below and above this dividing line between bullish and bearish territory. The clear break to the upside occurred on 10/24/11 and, effective 10/25/11, a new Buy signal for domestic equities went into effect.

As of today, our Trend Tracking Index (TTI—green line in above chart) has broken above its long term trend line (red) by +4.73%. Be sure to tune into my blog for the latest updates.

Read More

Major Market ETFs Slide Ahead Of Friday’s Jobs Data; UNG Shines, GAZ Tanks

Ulli Market Review Contact

[Chart courtesy of MarketWatch.com]

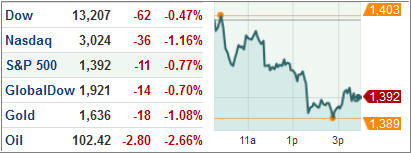
US stocks declined for the second day as investors took a cautious stance ahead of the US government’s monthly jobs report on Friday and digested mixed earnings reports. That should come as no surprise, as the jobs report is one of the most widely anticipated data points with market moving powers.

Investor sentiment got a boost in early trading after a report showed a decline in weekly jobless claims a day before the all-important April’s job reading. Treasuries changed little during the day’s trading to stay below the 2 percent mark for the longest stretch since January 19.

The Dow Jones Industrial Average (DJIA) slipped 61.98 points and the S&P 500 Index (SPX) shed 0.8 percent with energy leading the losers among its 10 major industry groups.

Read More

Treasuries Approach 3-Month High; US Equity ETFs End Mixed

Ulli Market Review Contact

[Chart courtesy of MarketWatch.com]

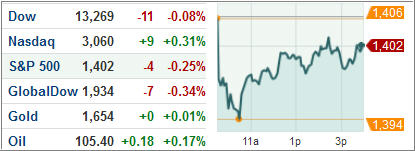
US markets ended mixed Wednesday as investors compared mostly robust corporate earnings with a weaker-than-expected private sector jobs report.

Treasury 10-year yield coming close to the lowest level in nearly three months as European manufacturing contracted sharply in April and investors tried to second guess the US non-farm payrolls report due on Friday.

The ADP Employer Services report for non-farm jobs showed companies added 119,000 jobs in April, much lower than the median 170,000 forecast by economists surveyed by Bloomberg.  The latest figure is significantly lower than the 201,000 job-additions reported in March.

Read More

7 ETF Model Portfolios You Can Use – Updated through 5/1/2012

Ulli Model ETF Portfolios Contact

The markets, as measured by the benchmark S&P 500, rallied since last week’s ETF Model portfolio report with the index gaining some 2.5%.

There were really no spectacular economic news to justify the advance; in fact, more negative than positive data points made the headlines, but the bulls seemed to have their eyes feasted on the potential safety net provided via more easing by the Fed. Go figure…

All model portfolios inched higher, as the latest update shows:

Read More

Strong Manufacturing Pushes Dow To Four Year High; KWT Pops, CVOL Slips

Ulli Market Review Contact

[Chart courtesy of MarketWatch.com]

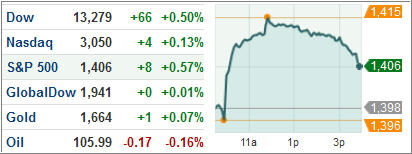
US stocks edged higher Tuesday after the latest ISM data indicated that US manufacturing activities expanded in April, offsetting concerns of an economic slowdown.

The Dow hit its highest level since 2007 on hopes of better jobless data due this week. Treasury yields climbed from near three-month lows after slipping yesterday as two regional Federal Reserve presidents announced that the central bank may hike interest rates earlier than estimated.

The Dow Jones Industrial Average (DJIA) climbed 0.5 percent for the day, its highest ending since Dec 2007. The S&P 500 Index (SPX) rose 0.6 percent with energy leading the gainer’s pack among the 10 industry groups.

Read More