ETF/No Load Fund Tracker Newsletter For Friday, August 24, 2012

Ulli Market Commentary Contact

ETF/No Load Fund Tracker StatSheet

————————————————————-

THE LINK TO OUR CURRENT ETF/MUTUAL FUND STATSHEET IS:

https://theetfbully.com/2012/08/weekly-statsheet-for-the-etfno-load-fund-tracker-newsletter-updated-through-08232012/

————————————————————

Market Commentary

Friday, August 24, 2012

A ROLLER COASTER: NOW FED STIMULUS HOPES ARE BACK ON; EUROPE ENDS WINNING STREAK

US equities fought back after a four-session slide ending the week on a high as hopes for monetary expansion received a boost after Fed chairman Bernanke said the central bank has more tools in its kitty to stimulate economic activity.

Remember, there was no promise of any QE but merely the mention that additional ammunition allegedly resides in the Fed’s toolkit. We’ve seen that all month as sentiment swung between “will” or “won’t” there be more stimulus, and markets simply reacted to those words when found in headline news. As a result, the Fed may never have to actually do anything but simply utter the word that Wall Street clamors.

The Dow Jones Industrial Average (DJIA) surged 0.8 percent, still off 0.7 percent for the week. Breadth within the blue-chip index turned positive after four down days with only four of its 30 components finishing lower. The S&P 500 Index (SPX) rose 0.7 percent, down 0.5 percent for the week while the NASDAQ Composite (COMP) added 0.5 percent, down 0.2 percent over last Friday.

Read More

Weekly StatSheet For The ETF/No Load Fund Tracker Newsletter – Updated Through 08/23/2012

Ulli ETF Tracker Contact

ETF/Mutual Fund Data updated through Thursday, August 23, 2012

If you are not familiar with some of the terminology used, please see the Glossary of Terms.


1. DOMESTIC EQUITY MUTUAL FUNDS/ETFs: BUY — since 10/25/2011

The domestic TTI broke through its long-term trend line generating a Sell for this area effective 8/9/2011. Over the recent past, we’ve seen the TTI hovering slightly below and above this dividing line between bullish and bearish territory. The clear break to the upside occurred on 10/24/11 and, effective 10/25/11, a new Buy signal for domestic equities went into effect.

As of today, our Trend Tracking Index (TTI—green line in above chart) has broken above its long term trend line (red) by +2.98%. A break back below it will generate a Sell signal to move out of all domestic equity positions. Be sure to tune into my blog for the latest updates.

Read More

Stock Indexes Retreat As Fed Stimulus Hope Fades; Europe Slides On PMI Data

Ulli Market Commentary Contact

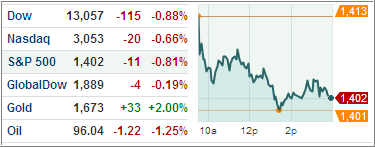
[Chart courtesy of MarketWatch.com]

Stock indexes tumbled with the Dow industrials posting its biggest fall in more than a month that also marked its fourth down day after global manufacturing data showed signs of slowdown and a US Fed official cast doubts over further accommodative policies soon.

The Dow Jones Industrial Average (DJIA) closed 115 points lower after losing as much as 126 points as breadth within the 30-component Dow turned overwhelmingly negative with 28 stocks ending in red.

Both the S&P 500 Index (SPX) and the tech-heavy NASDAQ Composite (COMP) tanked, down 0.8 percent and 0.7 percent respectively, which was long overdue as the indexes have done nothing but edge higher throughout August without any type of pullback. As I posted repeatedly, the only driver providing any type of momentum has been QE related hope.

Read More

Equities Pare Losses After Fed Minutes; Europe Slumps Ahead Of Greece Meeting

Ulli Market Commentary Contact

[Chart courtesy of MarketWatch.com]

Equities trimmed losses Wednesday with the broad market closing near flat after the minutes from the Fed’s last meeting showed many policy makers favored another round of monetary stimulus if the economy failed to show signs of a durable pick up.

The Dow Jones Industrial Average closed 31 points lower after sinking as much as 83 while breadth within the index remained positive with 16 of the blue-chip index’s 30 components closing higher.

A report released by the National Association of Realtors showed existing home sales rose 2.3 percent in July, diminishing chances of QE3 as economic indicators continue to strengthen. So, here we go again as a mixed plate is being served up but hope remains among the QE addicts that the spiked punch bowl will remain on the menu.

Read More

7 ETF Model Portfolios You Can Use – Updated through 8/21/2012

Ulli Model ETF Portfolios Contact

Inching ahead on continued central bank intervention hopes was the mode of operation last week, as the major indexes edged up with the S&P 500 taking out its 2012 high yesterday before selling set in.

With our international TTI having generated a new ‘Buy’ signal, as posted on Monday, and the domestic market heading to higher levels as well, I made some Model ETF Portfolio adjustments, by adding some (more conservative) equity positions back in. They are identified in the matrix as “new purchases.”

I stayed with less volatile holdings due to elevated market levels compared to what might have been my choice at the beginning of a new cycle. I still believe that upside potential is limited as opposed to ever increasing downside risk, although the temporary power of manipulating central banks supporting the markets can never be underestimated, as we’ve seen. The question in my mind is as to how long that condition can last.

Here’s the latest model portfolio update:

Read More

Major Market ETFs Retreat As Declining Tech Stocks Eclipse Euro Optimism; ECB Hope Drives Europe Higher

Ulli Market Commentary Contact

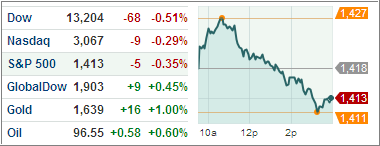
[Chart courtesy of MarketWatch.com]

Major Market ETFs retreated today with the S&P 500 climbing down from a four-year high as optimism over the European Central Bank’s possible intervention to limit the region’s contagion was eclipsed by a decline in US equities led by technology stocks.

The Dow Jones Industrial Average (DJIA) fell 0.5 percent, with 22 of the 30 stocks within the index ending in the negative territory. Both, the S&P 500 Index (SPX) and the tech-laden NASDAQ Composite (COMP) retreated, losing 0.4 percent and 0.3 percent respectively.

Investors sought refuge in safe-haven assets, pushing yields of Treasury 10-year notes down during the session after a slump in equities fueled worries whether EU leaders would move fast enough to arrest the region’s debt crisis.

Read More