ETF/No Load Fund Tracker Newsletter For Friday, October 19, 2012

Ulli ETF Tracker Contact

ETF/No Load Fund Tracker StatSheet

————————————————————-

THE LINK TO OUR CURRENT ETF/MUTUAL FUND STATSHEET IS:

https://theetfbully.com/2012/10/weekly-statsheet-for-the-etfno-load-fund-tracker-newsletter-updated-through-10182012/

————————————————————

Market Commentary

Friday, October 19, 2012

MAJOR MARKET ETFS LOG BIGGEST DECLINE IN FOUR MONTHS OVER WEAK EARNINGS; IS ANOTHER CRASH LURKING ON THE HORIZON?

On the 25th anniversary of the 1987 market crash, the major indexes dropped sharply causing fears of a repeat performance. In the bigger scheme of things, the S&P 500’s 1.67% retreat was fairly benign when considering the elevated level this index has been occupying especially in view of the fact that underlying fundamentals are totally out of sync.

While the markets managed to avoid a disaster, it does not mean one is not lurking on the horizon. To me, it’s a sure thing that major pullback will happen, but the timing of it is the great unknown, however, having lived through the 1987 market debacle, I can share some experiences with you.

1987 was the year when I designed the Trend Tracking Indexes (TTIs), of which my main focus had been the domestic version. It held up well during the 10/19/87 massacre by having generated a ‘Sell’ signal for all equity funds 2 days prior to the event.

Since then we have seen our share of market crashes, wars, and other disasters around the world. Here’s what I have found: While market pullbacks can occur at any time, true market crashes, such as in 1987, 2000 and 2008, just to name a few, have only occurred when the Domestic TTI was positioned below its long term trend line.

Read More

Weekly StatSheet For The ETF/No Load Fund Tracker Newsletter – Updated Through 10/18/2012

Ulli ETF StatSheet Contact

ETF/Mutual Fund Data updated through Thursday, October 18, 2012

If you are not familiar with some of the terminology used, please see the Glossary of Terms.


1. DOMESTIC EQUITY MUTUAL FUNDS/ETFs: BUY — since 10/25/2011

The Domestic TTI (Trend Tracking Index) broke through its long-term trend line generating a Sell for this area effective 8/9/2011. Over the recent past, we’ve seen the TTI hovering slightly below and above this dividing line between bullish and bearish territory. The clear break to the upside occurred on 10/24/11 and, effective 10/25/11, a new Buy signal for domestic equities went into effect.

As of today, our Trend Tracking Index (TTI—green line in above chart) has broken above its long term trend line (red) by +2.46%. A break back below it will generate a Sell signal to move out of all domestic equity positions. Be sure to tune into my blog for the latest updates.

Read More

Jobs Data Disappoints While Google Weighs On Equities; Europe Hits 16-Month High

Ulli Market Commentary Contact

[Chart courtesy of MarketWatch.com]

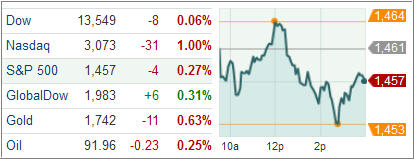
US stocks turned lower Thursday falling for the first time this week as tech giant Google missed earnings target highlighting the storm brewing in the tech sector while a rise in weekly jobless rate eclipsed upbeat manufacturing data.

The mood went sour after a Labor Department showed initial jobless claims jumped 46,000 to 388,000, reversing a previous report that showed jobless rate tumbled to a four-year low in a seasonal quirk. Equities however, came off session lows after a Federal Reserve Bank of Philadelphia report revealed manufacturing bounced back in October while a separate Conference Board’s index of economic indicators climbed 0.6 percent in September.

Despite some very marginal and some extremely poor earnings reports and other data points, the markets did not head south as much as you might have expected. Why is it that we seem to continuously manage to regain early losses later on in the day?

Read More

Equities Eke Out Gain As Housing Offsets Earnings Lag; Europe Up As Spain Retains Rating

Ulli Market Commentary Contact

[Chart courtesy of MarketWatch.com]

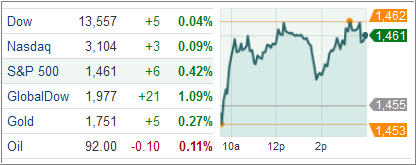
US equities managed modest gains Wednesday after a four-year high new-home construction data offset disappointing earnings results from technology bellwethers like IBM and Intel. It’s simply amazing to me that good data points (housing starts being one of them), way out of the range of normal, have appeared recently, very conveniently just prior to the elections.

It makes me wonder if there will be a market hangover once the election ordeal has finally passed and some reality as to the status of the real economy starts to sink in. Be that as it may, extending gains into the fourth session, the Dow Jones Industrial Average (DJIA) added 5 points. International Business Machines (IBM) witnessed the steepest fall, losing 4.9 percent, after Q3 revenues fell short of expectations. Breadth within the 30-component index traded positive with 23 stocks turning higher.

Shares of homebuilders surged after a Commerce Department report showed housing starts jumped 15 percent to an 872,000 annual rate last month, the most since July 2008 and better than what economists had predicted.

Read More

7 ETF Model Portfolios You Can Use – Updated through 10/16/2012

Ulli Model ETF Portfolios Contact

The continued sell off after last week’s model portfolio report was finally offset by a strong 2-day rebound, as the S&P 500 shifted back into rally mode gaining roughly 1% over the past 5 trading days.

Contributing to yesterday’s move higher were better than expected earnings from several bellwether companies. Nevertheless, worries remain that slower growth in Europe and Asia may be affecting US companies more than anticipated, while the rise in the US consumer index by 0.6% in September will not help consumers to go on a reckless spending spree, which is a prerequisite of pulling the economy out of the doldrums.

As mentioned last week, I updated all dividends and distributions in our model ETF portfolios, and you can review the latest update below:

Read More

US Stocks Rally On Economy, Earnings; Spain Lifts Europe

Ulli Market Commentary Contact

[Chart courtesy of MarketWatch.com]

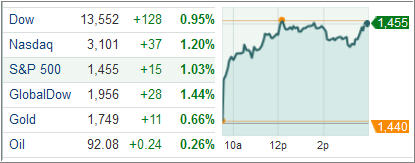
US stocks surged Wednesday with the Dow Industrials posting its biggest daily gain in more than a month following data showing a bunch of strong quarterly earnings report and a solid recovery in industrial activity in September.

Risk appetite got a boost after a Federal Reserve report showed industrial output climbed 0.4 percent in September, beating a 0.2 percent gain projected by economists. Manufacturing, which comprises 75 percent of the total, rose 0.2 percent during the period. Output at factories, mines and utilities had slumped 1.2 percent in August. A separate report, however, showed cost of living went up 0.6 percent in September, rising for the second successive month. Economists had projected a CPI gain of 0.5 percent for the month.

More good news followed from Europe after media reports suggested Germany may roll back its resistance to a full-blown Spanish bailout request. Finance Minister Wolfgang Schaeuble had cautioned Madrid against seeking a sovereign bailout in addition to its bank-bailout in September. According to reports, two lawmakers from the ruling Christian Democratic Party-led coalition indicated Germany is open to Spain requesting a precautionary credit line from the region’s permanent emergency fund, the European Stability Mechanism.

Read More