Weekly StatSheet For The ETF/No Load Fund Tracker Newsletter – Updated Through 11/21/2012

Ulli ETF StatSheet Contact

ETF/Mutual Fund Data updated through Wednesday, November 21, 2012
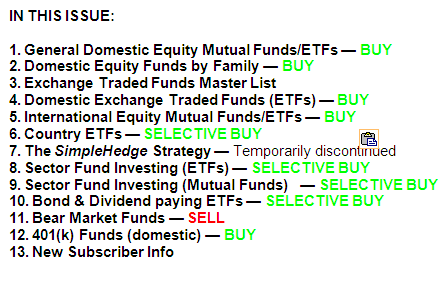
If you are not familiar with some of the terminology used, please see the Glossary of Terms.


1. DOMESTIC EQUITY MUTUAL FUNDS/ETFs: BUY — since 10/25/2011
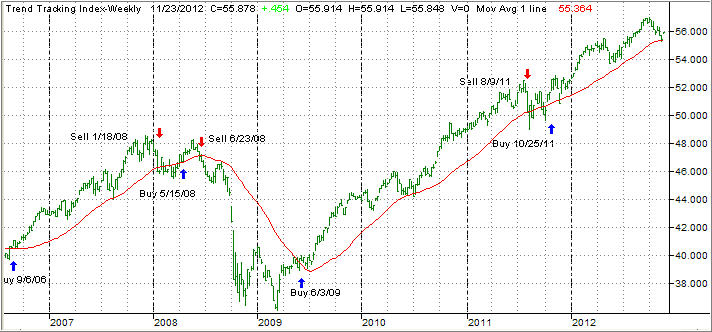
The domestic TTI broke through its long-term trend line generating a Sell for this area effective 8/9/2011. Over the recent past, we’ve seen the TTI hovering slightly below and above this dividing line between bullish and bearish territory. The clear break to the upside occurred on 10/24/11 and, effective 10/25/11, a new Buy signal for domestic equities went into effect.

As of today, our Trend Tracking Index (TTI—green line in above chart) has bounced off its long term trend line (red) by +0.97% after having dipped slightly below it.

To avoid a potential whip-saw, a Sell signal to move out of all domestic equity positions will be generated once we have clearly pierced the line to the downside. Be sure to tune into my blog for the latest updates.
Read More

Equities Inch Higher On Economy, Mideast; Europe Edges Up While Greece Lingers

Ulli Market Commentary Contact

[Chart courtesy of MarketWatch.com]

US equities managed to eke out modest gains with major averages hitting a near two-week high after a ceasefire deal was announced between Israel and Hamas in Egypt, propelling the S&P 500 and NASDAQ Composite into the expansionary territory for the fourth straight session.

In the US, weekly jobless claims dropped to 410,000, a Labor Department report showed, beating forecasts as fewer Americans filed first-time applications for unemployment benefits last week despite the severe impact of Superstorm Sandy.

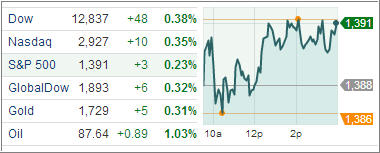
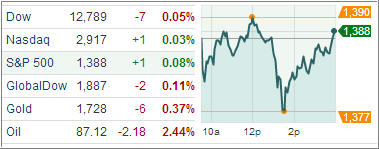
The Dow Jones Industrial Average (DJIA) moved up by 48 points while the S&P 500 Index (SPX) added 3 points with energy gaining the most and utilities the only sector to lose among its 10 business groups.

After finding support early on, Treasury yields edged higher, pushing prices down for the third straight day as positive US economic data offset renewed worries over Europe’s ability to solve the protracted debt crisis.

Read More

7 ETF Model Portfolios You Can Use – Updated through 11/20/2012

Ulli Model ETF Portfolios Contact

The major indexes got an assist this week, after sliding lower into last Friday’ close, in the form of renewed hope that Washington’s finest will come together and attack the fiscal cliff crises with some form of compromise. Nothing was really resolved, but an oversold market in dire need of a bone took the faintest hint that some form of cooperation was possible and rallied sharply.

Whether that was just a dead cat bounce remains to be seen, but the S&P 500 managed to climb almost 1% since last week’s ETF Model Portfolio report. More clarity may not come until next Monday when Wall Street will be fully staffed and back from the Thanksgiving holiday.

Here’s the latest update to our ETF Model Portfolios:

Read More

US Rally Fizzles As HP Plunge Offset Housing Gains; Europe Buoyed By Mideast Hope

Ulli Market Commentary Contact

[Chart courtesy of MarketWatch.com]

Capping a choppy trading session, US stocks finished little changed Tuesday after an early rally triggered by an increase in housing starts in October was offset by a sharp sell-off in Hewlett-Packard shares.

The looming budget negotiations on tax hikes and spending cuts continued to weigh on investors after Federal Reserve Chairman Ben Bernanke urged lawmakers in Washington to act quickly on the so-called fiscal cliff because the “stakes are high.” The central banker reiterated his assertion that the Fed doesn’t have the necessary tools to offset the potential harm and an agreement to reduce long-term US deficits may remove an obstacle to economic growth.

The Fed’s policies have helped temper the headwinds holding back the economic recovery, though it’s too early to assess the full impact of the Fed’s mortgage-bonds purchase program started in September to stimulate the housing market, he added. Analysts were, however, expecting confirmation that the central bank would extend its concurrent long-term Treasury bonds purchase program, known as Operation Twist, after it ends next month.

Read More

Fiscal Cliff Hope Fest Pushes Indexes Higher, But On Very Low Volume; Europe Surges

Ulli Market Commentary Contact

[Chart courtesy of MarketWatch.com]

US stocks surged Monday to log their biggest single-session gain in months on positive housing data and increasing investor confidence that a budget deal would be reached in Washington. Mind you that a deal is pure hope at this time, and I have my doubts that total cooperation without any battle will actually be feasible.

Wall Street got an early boost after a National Association of Realtors report showed existing home sales grew at 2.1 percent to an annual rate of 4.79 million in October despite the impact of Hurricane Sandy.

Separately, the National Association of Home Builders/Wells Fargo index of builder’s sentiment advanced for a seventh straight month to 46, the highest since May 2006.

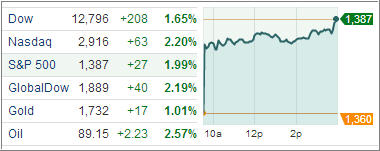
The Dow Jones Industrial Average (DJIA) jumped 208 points, posting its biggest gain since early September with all its 30 components rising and financial stocks gaining the most.

The S&P 500 Index (SPX) surged 27 points with consumer sectors gaining the most and all the 10 business sectors but utility closing higher.

Read More

ETFs/Mutual Funds On The Cutline – Updated Through 11/16/2012

Ulli ETFs on the Cutline Contact

Below are the latest ETF Cutline reports, which show how far above or below their respective long-term trend lines (39 week SMA) my currently tracked ETFs/MFs are positioned.

The first report covers the ETF Master List from Thursday’s StatSheet and includes 398 ETFs, of which currently 118 (last week 214) of them are hovering in bullish territory.

The second report includes only High Volume ETFs. To clarify, High Volume (HV) ETFs are defined as those with an average daily volume of $10 million or higher.

These ETFs are generated from my selected list of some 93 that I use in my advisor practice. It cuts out the “noise,” which simply means it eliminates those ETFs that I would never buy because of their volume limitations. 32 ETFs (last week 54) have managed to remain in bullish territory after the recent market volatility.

The third report covers Mutual Funds on the Cutline. There are currently 217 (last week 435) above the line and 645 below it out of the 861 that I follow.

Take a look:

1. ETF Master Cutline Report

2. ETF High Volume Cutline Report

3. MF Cutline Report

In case you are not familiar with some of the terminology used in the reports, please read the Glossary of Terms.