Rising Bond Yields And Oil Prices Drag Major Indexes Down

Ulli Market Commentary Contact

[Chart courtesy of MarketWatch.com]

  1. Moving the market

The financial markets were significantly impacted by climbing bond yields and surging oil prices, which drove the major indexes down throughout the session.

The 10-year yield rose above the 4% mark for the first time since August, rebounding from a low of 3.60% in September. This sharp increase comes despite the Federal Reserve’s efforts to lower rates.

Last week was turbulent, with only modest gains for the averages. However, a better-than-expected jobs report, at least in terms of the headline number, has led traders to believe that the Fed might achieve a soft landing for the economy.

While this outcome remains uncertain, the long-term trend is still upward, and we plan to stay the course until it changes. The Fed’s minutes from its last meeting will be released on Wednesday, followed by the Consumer Price Index (CPI) report on Thursday.

Expectations for rate cuts plummeted, causing all major indexes to decline. The MAG7 basket was also affected by Google’s weakness due to an app store injunction requiring them to open their app store to competition.

The most shorted stocks fell, erasing Friday’s gains. Bond yields surged further, with both the 2-year and 10-year yields piercing the 4% level. Interestingly, the dollar remained stable, and gold stayed within its recent trading range.

Bitcoin exhibited volatility, rallying, and then receding twice, influenced by the Google headlines.

Meanwhile, the risk of a U.S. foreign default continues to rise.

Read More

ETFs On The Cutline – Updated Through 10/04/2024

Ulli ETFs on the Cutline Contact

Do you want to know which ETFs are hot and which ones are not? Then you need my High-Volume ETF Cutline report. It tells you how close or far each of the 311 ETFs I follow is from its long-term trend line (39-week SMA). These are the ETFs that trade more than $5 million a day, so they are not some obscure funds that nobody cares about.

The report is split into two parts: The winners that are above their trend line (%M/A), and the losers that are below it. The yellow line is the line of shame that separates them. You can see how many ETFs are in each group and how they have changed since the last report (274 vs. 280 current).

Take a peek:

The HV ETF Master Cutline Report

If you are confused by some of the terms we use, don’t panic. I have a helpful Glossary of Terms for you. If you want to learn more about the Cutline method and how it can make you rich (or at least less poor), read my original post here.

ETF Tracker Newsletter For October 4, 2024

Ulli Market Commentary Contact

ETF Tracker StatSheet          

You can view the latest version here.

GOVERNMENT JOBS SOAR, PRIVATE SECTOR GROWTH LAGS

[Chart courtesy of MarketWatch.com]

  1. Moving the market

The much-anticipated jobs report exceeded expectations, driving major indexes higher. However, the question remains: how much will these figures be revised in the future? Historically, six out of the last seven releases have been significantly downgraded.

Nonfarm payrolls surged by 254,000 jobs last month, far surpassing the expected 150,000 and marking the largest increase since March. The unemployment rate also improved, dropping to 4.1% from 4.2%.

Traders reacted positively to this news, interpreting it as a sign of a robust labor market and a resilient economy. This optimism persists despite ongoing issues such as record layoffs, bankruptcies, soaring food prices, and struggling consumers.

A closer examination of the jobs report reveals fewer encouraging details. Government employment saw a record increase, while private sector job growth was limited to 133,000, reflecting the current challenges in the labor market.

The US Citi Surprise Index turned positive this week, with rate-cut expectations plummeting and bond yields surging. The 10-year yield, which had recently dipped to 3.60%, rebounded sharply towards the critical 4% threshold, last seen in August. This movement strengthened the dollar, which rose for five consecutive days, but it also led to declines in gold and Bitcoin prices.

Amid persistent Middle East tensions, crude oil prices spiked, achieving their best week since October 2022.

Despite the positive jobs report, concerns about the increasing risk of a US sovereign default remain. Will this risk diminish as it did after peaking in May, or is this time different?

Read More

Weekly StatSheet For The ETF Tracker Newsletter – Updated Through 10/03/2024

Ulli ETF StatSheet Contact

ETF Data updated through Thursday, October 3, 2024

How to use this StatSheet:

  1. Out of the 1,800+ ETFs out there, I only pick the ones that trade over $5 million per day (HV ETFs), so you don’t get stuck with a lemon that nobody wants to buy or sell.
  1. Trend Tracking Indexes (TTIs)

These are the main indicators that tell you when to buy or sell Domestic and International ETFs (section 1 and 2). They do that by comparing their position to their long-term M/A (Moving Average). If they cross above, and stay there, it’s a green light to buy. If they fall below, and keep going, it’s a red light to sell. And to make sure you don’t lose your shirt if things go south, I also use a 12% trailing stop loss on all positions in these categories.

  1. All other investment areas don’t have a TTI and should be traded based on the position of each ETF relative to its own trend line (%M/A). That’s why I call them “Selective Buy.” In other words, if an ETF goes above its own trend line, you can buy it. But don’t forget to use a trailing sell stop of 12%, or less if you’re feeling nervous.

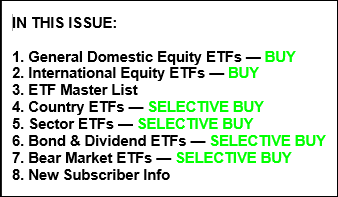
If some of these words sound like Greek to you, please check out the Glossary of Terms and new subscriber information in section 9.

  1. DOMESTIC EQUITY ETFs: BUY— since 11/21/2023

Click on chart to enlarge

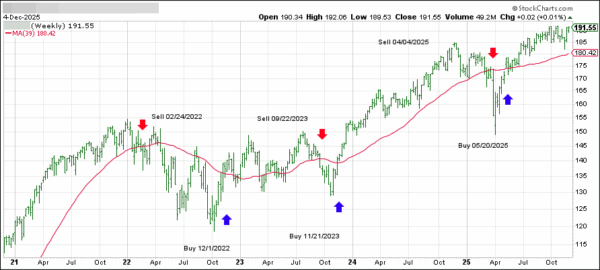
This is our main compass, the Domestic Trend Tracking Index (TTI-green line in the above chart). It has broken above its long-term trend line (red) by +7.80% and is in “Buy” mode as posted.

Read More

Market Uncertainty Prevails Amid Rising Oil Prices And Economic Concerns

Ulli Market Commentary Contact

[Chart courtesy of MarketWatch.com]

  1. Moving the market

The stock market exhibited a pattern of bobbing and weaving today, as uncertainty dominated, and the major indexes fluctuated around their respective unchanged lines.

October has started on a weak note, with sentiment dampened by escalating tensions in the Middle East and the uncertain impact and duration of the East Coast port strike. Both events are expected to negatively affect the economy, but the extent of this impact remains unclear.

Growing concerns have driven oil prices up by nearly 4%, pushing them above the $73 mark to reach one-month highs. Energy equities followed suit, and even some tech heavyweights saw gains, with Nvidia rising over 3%.

Initial jobless claims continue to decline, despite a 53.4% year-over-year increase in job cut announcements. Once these job cuts translate into actual layoffs, we can expect the trend in jobless claims to reverse and head higher.

Bond yields rose due to underlying inflation data, rising oil prices, and a surprising drop in rate-cut expectations, all of which sent the dollar higher and the major indexes lower. Bitcoin found support at $60,000, while gold maintained its gains, adding 0.31% for the session.

Meanwhile, U.S. sovereign risk continued to climb, as did the Citi Economic Surprise Index, which has now reached six-month highs. This raises the question: Was the economy really in need of a 0.5% rate cut?

Read More

ADP Data Shows Strong Job Growth, Eyes On Friday’s Payroll Report

Ulli Market Commentary Contact

[Chart courtesy of MarketWatch.com]

  1. Moving the market

The markets began the second day of October in negative territory, driven by escalating tensions in the Middle East. Despite this, the markets closed relatively unchanged, with China’s recent upward trend continuing, bolstered by their substantial stimulus program.

Nike experienced a significant 7% drop after canceling its full-year guidance ahead of a new CEO’s arrival. Meanwhile, the tech sector lacked direction, with Tesla shares falling over 4% due to disappointing delivery numbers.

Traders currently view these geopolitical tensions as a temporary disruption. However, the potential economic impact could be more severe, especially as the effects of the East Coast port strike become apparent.

On a positive note, ADP data revealed better-than-expected private payroll growth last month, with 143,000 new jobs created compared to the anticipated 125,000. However, this does not guarantee that Friday’s nonfarm payroll report will follow the same trend. The upcoming report could significantly influence the market’s direction and the Federal Reserve’s next interest rate decision.

The MAG7 basket initially slipped but managed to recover, cutting its early losses as bond yields rose. This increase supported the dollar but negatively impacted gold and Bitcoin, with the latter experiencing a more substantial decline.

Crude oil prices fluctuated after yesterday’s rally, as Middle East tensions remained high. Although it was a quiet day in the markets, this could quickly change with the release of the payroll numbers on Friday.

Seasonally, we have entered one of the most volatile periods of the year, with the VIX likely to increase significantly, as indicated in this chart.

Read More