Weekly StatSheet For The ETF/No Load Fund Tracker Newsletter – Updated Through 01/10/2013

Ulli ETF StatSheet Contact

ETF/Mutual Fund Data updated through Thursday, January 10, 2013
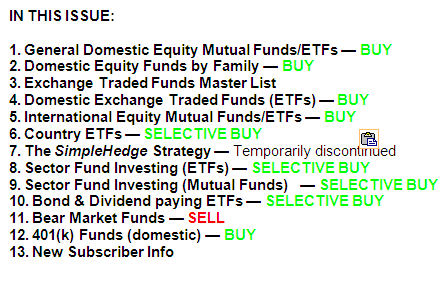
If you are not familiar with some of the terminology used, please see the Glossary of Terms.


1. DOMESTIC EQUITY MUTUAL FUNDS/ETFs: BUY — since 10/25/2011
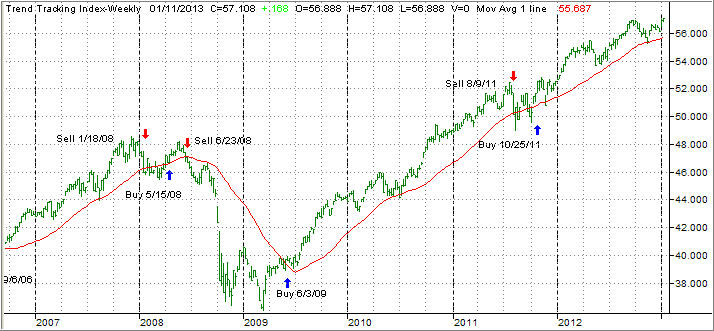
The domestic TTI broke through its long-term trend line generating a Sell for this area effective 8/9/2011. Over the recent past, we’ve seen the TTI hovering slightly below and above this dividing line between bullish and bearish territory. The clear break to the upside occurred on 10/24/11 and, effective 10/25/11, a new Buy signal for domestic equities went into effect.

As of today, our Trend Tracking Index (TTI—green line in above chart) has bounced off its long term trend line (red) by +2.66% after recently having dipped slightly below it.

To avoid a potential whip-saw, a Sell signal to move out of all domestic equity positions will be generated once we have clearly pierced the line to the downside. Be sure to tune into my blog for the latest updates.
Read More

Chinese Export Data Lifts Equities; Europe Falters As ECB Keeps Rates On Hold

Ulli Market Commentary Contact

[Chart courtesy of MarketWatch.com]

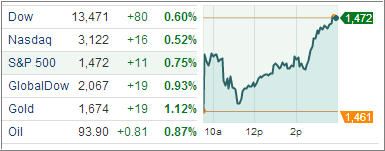
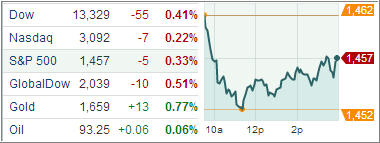
US stocks advanced for a second straight day, sending the S&P 500 to a fresh five-year closing high after exports data from China bolstered the view the global economy is on the mend.

China’s December exports surged 14.1 percent from a year earlier, almost triple the 5 percent growth projected by analysts and well ahead of the 2.9 percent gain recorded in November. Imports also grew by a comparatively modest 6 percent from the final month of 2011, boosting trade surplus for December.

Investors also contemplated the latest labor market data that showed initial jobless claims rose 4000 to 371,000 in the latest week. A separate report showed inventories at US wholesalers grew by 0.6 percent in November, which was higher than economists had estimated.

None of these two items mattered as the indexes got their usual afternoon lift, which has been the theme for quite some time in this centrally planned market environment. Negative reports are ignored, and the indexes continue to rise with no regards to underlying fundamentals. It sure makes me wonder how long this can continue…

Read More

7 ETF Model Portfolios You Can Use – Updated through 1/8/2013

Ulli Model ETF Portfolios Contact

The equity rebound continued into the New Year with the S&P 500 gaining some 2% as relief over the watered down fiscal cliff solution translated into reckless support for stocks.

I have rebalanced all ETF Model Portfolios as of 12/31/12, since ‘Buy’ signals were still in effect at that time. The #6 Ivy Portfolio was replaced with a new Bond ETF portfolio, as many readers had requested.

Here’s the latest update for the first week of 2013:

Read More

More Slippage Ahead Of Earnings Season; Europe Retreats On Mixed Data

Ulli Market Commentary Contact

[Chart courtesy of MarketWatch.com]

US equities extended modest losses into a second straight session as investors braced for the start of corporate earnings season. I did not know that two down days in a row were still permitted in this centrally planned economy, but I stand to be corrected…

In economic news, US consumers expanded their debt to $16.1 billion in November, raising credit at an annual clip of seven percent, a Federal Reserve report showed in Washington. Credit had grown by $14.2 billion in October.

Separately, the small business optimism index edged higher in December, the National Federation of Independent Business said Tuesday. The latest reading is still the second-worst since March 2010.

Read More

Indexes Retreat Ahead Of Earnings Season; Europe Slips On Profit Taking

Ulli Market Commentary Contact

[Chart courtesy of MarketWatch.com]

US stocks fell Monday with the S&P 500 index coming off a five-year high as Wall Street shifted its focus from the nation’s fiscal woes to the start of corporate earnings season tomorrow.

Aluminum maker Aloca Inc will unofficially kick-off the fourth-quarter earnings season after the market closes on Tuesday.  Fourth quarter earnings for S&P 500 companies are expected to rise 2.8 percent compared with the same period in 2011, according to Thomson Reuters data.

Meanwhile Republicans in Washington linked raising the US debt-ceiling to reduced spending on entitlement programs including Medicare, while Democrats looked for additional revenue.  That will shape up to be a hard fought battle.

Read More

ETFs/Mutual Funds On The Cutline – Updated Through 1/4/2013

Ulli ETFs on the Cutline Contact

Below are the latest ETF Cutline reports, which show how far above or below their respective long-term trend lines (39 week SMA) my currently tracked ETFs/MFs are positioned.

The first report covers the ETF Master List from Thursday’s StatSheet and includes 398 ETFs, of which currently 362 (last week 300) of them are hovering in bullish territory.

The second report includes only High Volume ETFs. To clarify, High Volume (HV) ETFs are defined as those with an average daily volume of $10 million or higher.

These ETFs are generated from my selected list of some 93 that I use in my advisor practice. It cuts out the “noise,” which simply means it eliminates those ETFs that I would never buy because of their volume limitations. 84 ETFs (last week 71) have managed to remain in bullish territory after the recent market volatility.

The third report covers Mutual Funds on the Cutline. There are currently 771 (last week 562) above the line and 88 below it out of the 859 that I follow.

Take a look:

1. ETF Master Cutline Report

2. ETF High Volume Cutline Report

3. MF Cutline Report

In case you are not familiar with some of the terminology used in the reports, please read the Glossary of Terms.