ETF/No Load Fund Tracker Newsletter For Friday, February 1, 2013

Ulli ETF Tracker Contact

ETF/No Load Fund Tracker StatSheet

————————————————————-

THE LINK TO OUR CURRENT ETF/MUTUAL FUND STATSHEET IS:

https://theetfbully.com/2013/01/weekly-statsheet-for-the-etfno-load-fund-tracker-newsletter-updated-through-01312013/

————————————————————

Market Commentary

Friday, February 1, 2013

DOW TOPS 14,000 ON JOBS DATA; EUROPE RISES AS US RECOVERY ALLEGEDLY GAINS TRACTION

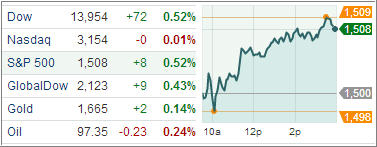
US stocks rallied Friday with the Dow Industrials closing above 14,000 for the first time since 2007 after upbeat reports on the labor market and manufacturing boosted investor confidence in the world’s largest economy.

Markets surged after a Labor Department report showed the economy added 157,000 jobs in January following a revised 196,000 gain in the previous month and a 247,000 spike in November. The revisions revealed the economy added 335,000 more jobs than originally reported. Though the January reading fell short of the 180,000 rise projected by economists, investors were encouraged by the fairly healthy 181,000 per month addition in 2012. Unemployment rate, however, ticked higher to 7.9 percent in January from 7.8 percent in the previous month.

Separately, the Institute for Supply Management’s manufacturing index rose to a nine-month high of 53.1 in January, topping estimates of 50.5, in a sign that manufacturing is on the path to recovery.
Read More

Weekly StatSheet For The ETF/No Load Fund Tracker Newsletter – Updated Through 01/31/2013

Ulli ETF StatSheet Contact

ETF/Mutual Fund Data updated through Thursday, January 31, 2013

Table of Content082312

If you are not familiar with some of the terminology used, please see the Glossary of Terms.


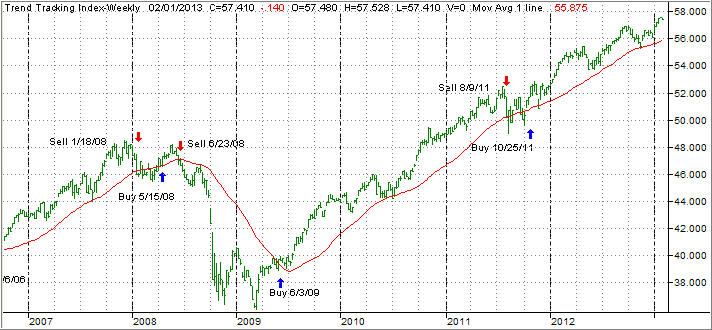
1. DOMESTIC EQUITY MUTUAL FUNDS/ETFs: BUY — since 10/25/2011

TTI

The domestic TTI broke through its long-term trend line generating a Sell for this area effective 8/9/2011. Over the recent past, we’ve seen the TTI hovering slightly below and above this dividing line between bullish and bearish territory. The clear break to the upside occurred on 10/24/11 and, effective 10/25/11, a new Buy signal for domestic equities went into effect.

As of today, our Trend Tracking Index (TTI—green line in above chart) has bounced off its long term trend line (red) by +2.87% as part of the post election rebound.

To avoid a potential whip-saw, a Sell signal to move out of all domestic equity positions will be generated once we have clearly pierced the line to the downside. Be sure to tune into my blog for the latest updates.

Read More

Equity Indexes Retreat, But Notch Strong January; Europe Edges Lower

Ulli Market Commentary Contact

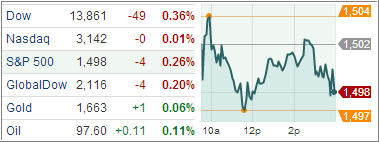
Thur pic

[Chart courtesy of MarketWatch.com]

Equity ETFs finished lower Thursday, ending a blockbuster month on a soft note after a government report showed jobless claims rose, but the Dow Jones Industrial Average still managed to produce the best January rally since 1994.

First time claims for unemployment benefits climbed 38,000 to 368,000 last week, the first rise in two weeks, a Labor Department report showed. The weekly data comes ahead of tomorrow’s all-important nonfarm-payrolls number for January.

Separately, a Commerce Department report showed consumer spending rose by 0.2 percent while personal income jumped 2.6 percent in January, boosted by early dividend payments. The Chicago-area Purchasing Manager’s Index rose to 55.6 in January, the highest level since April 2012, from an upwardly revised 50 level.

Read More

GDP Experiences Shrinkage; Stocks Retreat On Growth Worries; Europe Falls After US Economic Data

Ulli Market Commentary Contact

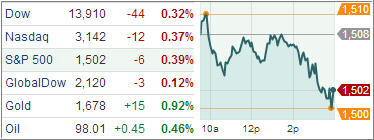
Wed pic

[Chart courtesy of MarketWatch.com]

US equities finished lower Wednesday, dragging the index averages off five-year highs after the Federal Reserve said economic growth had paused following the release of a government report that showed the US economy contracted in the fourth quarter.

The Federal Open Market Committee kept interest rates unchanged at near zero and maintained its aggressive bond-buying program. The central bank said it will keep purchasing bonds at the rate of $85 billion a month after concluding its two-day policy-setting meeting today.

Earlier in the day, the Commerce Department said the economy contracted at a 0.1 percent annual pace in the final quarter of last year, falling short of the 1 percent growth projected by economists.

Gross Domestic Product, the aggregate of all goods and services produced, fell to its lowest level since the second quarter of 2009, when the economy was still in recession. Today’s report, however, contained a few bright spots such as an uptick in business investment, consumer spending and home building, suggesting the pause was probably due to bad weather and other transitory factors, and the underlying economy possibly grew at around 2 percent, if you can believe this type of Main Stream Media spin.

Read More

7 ETF Model Portfolios You Can Use – Updated through 1/29/2013

Ulli Model ETF Portfolios Contact

More of the same was the motto for this past week as the S&P 500 added about 1% and clearly pierced its 1,500 milestone marker to the upside.

Bad news, good news or no news; it does not really matter; the indexes are being pushed up without regards to any economic reality, which is the hallmark of the central planning efforts.

Sure, it’s really tempting to throw caution to the wind by exposing your portfolio to 100% equities to take advantage of the relentless upswing. However, since upward momentum is being artificially created, there will be a point of reckoning when index levels and fundamentals finally meet. That may be the moment when the ensuing trend reversal could accelerate into something really fearsome.

That’s why the wiser choice is to keep your portfolio mix between equities and bonds alive which, when combined with my recommended sell stop discipline, will at least give you a fighting chance to preserve your capital once the inevitable downturn strikes.

Here’s the latest update for our Model ETF Portfolios:

Read More

Up, Up And Away; Dow Hits 2007 High; Europe Touches 23-Month High

Ulli Market Commentary Contact

Tue pic

[Chart courtesy of MarketWatch.com]

Equity ETFs mostly advanced today with the Dow Jones Industrial Average hitting a five-year high after data released showed continued improvement in housing and companies including Pfizer and Valero Energy reported earnings that beat estimates.

The indexes picked up pace and rallied as the S&P/Case-Shiller index of US property values rose 5.5 percent in November after rising a downwardly revised 4.2 percent in the preceding month to post the biggest year-on-year gain since 2006.

On the downside, the Conference Board’s index of consumer confidence declined to 58.6, the least since 58.6 November 2011 and well short of the 64 forecast by Bloomberg.

Tuesday also marked the start of US Fed’s first monetary policy meeting of the year. After the conclusion of the two-day meeting on Wednesday afternoon, investors will look for clues in the Federal Open Market Committee’s statement for when the bond buying program may end.

Read More