New ETFs On The Block: Market Vectors Treasury-Hedged High Yield Bond ETF (THHY)

Ulli Income ETFs Contact

156288184Van Eck Global, the New York-based fund provider behind the Market Vectors ETFs, has rolled out the Market Vectors Treasury-Hedged High Yield Bond ETF (THHY). The fund seeks to exploit the income potential of below investment-grade US corporate bonds in low interest-rate environments, but hedges the interest rate risk through the use of Treasury notes. In other words, it’s an attempt to give a purer exposure to credit risk while hedging interest rate risk.

THHY follows the Market Vectors US Treasury-Hedged High Yield Bond Index (MVTHHY), an in-house index that follows a long-short strategy and invests in dollar-denominated, junk corporate bonds, while shorting Treasury notes to hedge against adverse interest rate movements.

Since bond yields and prices move in opposite directions, if interest rates rise back to normal levels, price of high-yield “junk” bonds will fall while profits from the short position in Treasuries will rise, thus offsetting the price decline in junk bonds.
Read More

ETF/No Load Fund Tracker Newsletter For Friday, March 29, 2013

Ulli ETF Tracker Contact

ETF/No Load Fund Tracker StatSheet

————————————————————-

THE LINK TO OUR CURRENT ETF/MUTUAL FUND STATSHEET IS:

https://theetfbully.com/2013/03/weekly-statsheet-for-the-etfno-load-fund-tracker-newsletter-updated-through-03282013/

————————————————————

Market Commentary

Friday, March 29, 2013

S&P 500, DOW HIT RECORD HIGHS ON GDP DATA; EUROPE STOCKS UP FOR A SECOND MONTH

US stock indexes closed higher, wrapping up a strong first quarter Thursday with the S&P 500 and the Dow industrials finishing at a new high as US economic expansion slowed less than previously estimated and worries over Europe’s debt crisis abated.

Equities gained after the open as a revised Commerce Department report in Washington showed gross domestic product rose at a 0.4 percent annual clip in the final three months of 2012, up from a 0.1 percent previous estimate and following a 3.1 percent pace in the third quarter.

However, on a downbeat note, first-time jobless claims climbed by 16,000 to 357,000 in the week ended March 23, the highest in over a month.

And, a gauge of business activity in the Chicago region came in worse than expected. The Purchasing Managers Index dropped to 52.4 percent in March as new orders, order backlogs and inventories suffered setbacks. Economists had predicted a reading above 56 though any reading above 50 indicates expansion.

Read More

Weekly StatSheet For The ETF/No Load Fund Tracker Newsletter – Updated Through 03/28/2013

Ulli ETF StatSheet Contact

ETF/Mutual Fund Data updated through Thursday, March 28, 2013

Table of Content082312

If you are not familiar with some of the terminology used, please see the Glossary of Terms.


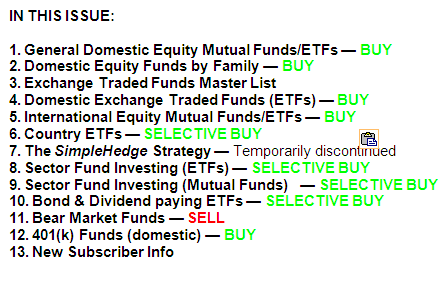
1. DOMESTIC EQUITY MUTUAL FUNDS/ETFs: BUY — since 10/25/2011

TTI

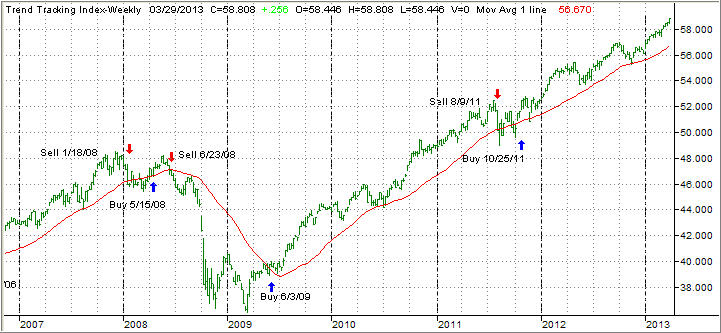
The domestic TTI broke through its long-term trend line generating a Sell for this area effective 8/9/2011. Over the recent past, we’ve seen the TTI hovering slightly below and above this dividing line between bullish and bearish territory. The clear break to the upside occurred on 10/24/11 and, effective 10/25/11, a new Buy signal for domestic equities went into effect.

As of today, our Trend Tracking Index (TTI—green line in above chart) has bounced off its long term trend line (red) by +3.96% as part of the post election rebound.

To avoid a potential whip-saw, a Sell signal to move out of all domestic equity positions will be generated once we have clearly pierced the line to the downside. Be sure to tune into my blog for the latest updates.

Read More

A Mixed Day On Data And Europe; Italian Political Turmoil Weighs

Ulli Market Commentary Contact

Wed pic

[Chart courtesy of MarketWatch.com]

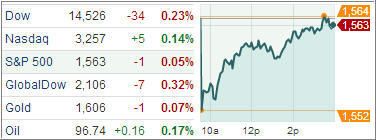
The major indexes recovered from an early drop to finish mixed amid concerns Europe’s debt crisis is worsening and as pending home sales in the US tripped in February.

Equities headed to their session lows shortly after the open when a report from the National Association of Realtors showed pending home sales declined 0.4 percent in February following a revised 3.8 percent hike the prior month. The trade group cited limited supply of homes in certain parts of the country for the recent weakness.

Stocks however, recovered the bulk of their losses soon after, with the NAR data having little impact on equities.

Separately, the Institute of International finance said banks in Spain, Italy and Portugal may come under funding pressure following a controversial deal in Cyprus that saw imposition of levy on private bank deposits for a 10-billion euro bailout package.

Read More

7 ETF Model Portfolios You Can Use – Updated through 3/26/2013

Ulli Model ETF Portfolios Contact

The events in Cyprus were front and center over the past week as the story lines changed more often than I care to count. In the end, the parliamentary process was circumvented as the European overlords dictated the terms without paying any attention to minor details such as a democratic process.

That’s been pretty much the theme throughout the European debt crisis as non-elected government officials make the rules without wanting to engage the voting public. Nevertheless, the S&P 500 recuperated from the prior small pullback and advanced 1% since last week’s ETF Model Portfolio report.

The benchmark has now reached a level that is again within striking distance of its 2007 all-time high, and I expect that number to be taken out shortly.

If you feel like you are left out and can’t decide how to participate conservatively in this bullish run, feel free to give to email me or give me a call. Especially, if you have a 401k with one of the large providers such as Fidelity or Vanguard, there are low volatility mutual funds in existence you are probably not aware of that are very suitable with trend tracking.

In the meantime, here is the latest update for our Model ETF Portfolios, which you can use based on your risk tolerance:

Read More

US Indexes Surge On Manufacturing, Housing Improvement; Europe Rises On US Data

Ulli Market Commentary Contact

Tue pic

[Chart courtesy of MarketWatch.com]

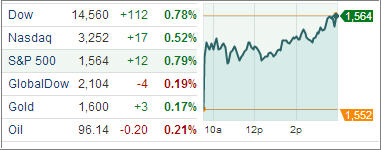
Index ETFs advanced Tuesday, with the S&P 500 Index rebounding to within two points of its record and the Dow Industrials hitting a new high, after US durable goods orders rose more than estimated in February and home prices jumped the most since June 2006.

The Commerce Department reported orders for durable goods rose 5.7 percent in February, mainly due to a surge in automobile and aircraft orders. The number exceeds expectations of a growth rate of about 5 percent and suggests the economy is expanding at a 2.5-3 percent annual rate.

Equities got a boost today as residential real estate prices rose by 8.1 percent in January from a year ago, marking the biggest year-over-year growth since June 2008, according to the S&P Case-Shiller index released today.

On a downbeat note, consumer confidence slumped to 59.7 in March from a revised three-month high of 68 in the prior month as Washington’s budget battle soured Americans’ outlook of the economy.

Read More