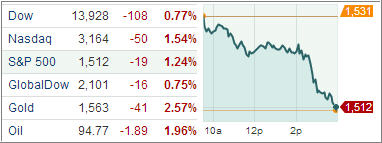
One Man’s Opinion: Do US Banks Still Pose A Systemic Risk To The Economy?

Ulli Market Commentary Contact

Legendary investor Warren Buffet thinks US banks are out of the woods. In a recent interview with the Bloomberg, Buffet said he guarantees US banks will not get the country in trouble as capital ratios are huge and the excesses on the asset side has been largely cleared out.

Neil Barofsky, a former inspector for the Treasury’s Troubled Assets Relief Program and a Bloomberg Television contributing editor, begs to differ and believes large US banks still pose systemic risk to the economy.

There’s a difference between things being improved and sufficient, said Neil, adding the bank capitals today are much better than they were at the heart of the crisis, and the banks and the government gets some credit for pushing that. But that’s not to say it’s sufficient.

If you look at how much capital they actually have after considering the complex risk-weightings and the non-tangibles that count as capital, and then if you consider the more aggressive way that Europe counts as capital for its banks, you still are looking at leverage ratios of 33-to-1; Lehman-type territory. So it’s good that there are higher capital ratios, but to say they won’t cause trouble is a bridge too far, Neil observed.

Read More

New ETFs On The Block: iPath S&P MLP ETN (IMLP)

Ulli Master Limited Partnerhips Contact

iPath, the exchange-traded note issuer arm of Barclays Bank PLC, has recently announced the launch of iPath S&P MLP ETN (IMLP), an exchange-traded note (ETN) that aims to provide investors exposure to the Standard & Poor MLP Index.

IMLP pays a variable coupon quarterly and is designed to provide access to the energy infrastructure-focused Master Limited Partnership (MLP) segment, a small but vibrant pocket populated by investors who wish to avoid the low yielding bond fund sector.

Energy infrastructure tracking MLPs are usually operators and owners of assets that are used for storage and supply of energy products such as oil and gas pipelines and storage facilities. The S&P MLP index, the fund’s underlying index, follows firms that trade publically as LLPs  with the legal structure and tax benefits similar to MLPs or as pure MLPs on major US exchanges such as the NYSE or the NASDAQ, and are listed either in the Gas Utilities Industry or the GICS Energy Sector.

MLPs display three distinct characteristics that make them attractive to certain investors:

Read More

01-11-2013

Ulli Newsletter Archives Contact

ETF/No Load Fund Tracker Newsletter For Friday, January 11, 2013

ETF/No Load Fund Tracker StatSheet

————————————————————-

THE LINK TO OUR CURRENT ETF/MUTUAL FUND STATSHEET IS:

https://theetfbully.com/2013/01/weekly-statsheet-for-the-etfno-load-fund-tracker-newsletter-updated-through-01102013/

————————————————————

Market Commentary

Friday, January 11, 2013

STOCK INDEXES FINISH HIGHER FOR THE SECOND STRAIGHT WEEK; EUROPEAN EQUITIES SLIP

US stock indexes changed little Friday, a day after the S&P 500 index rose to a five-year high as investors digested news of weak bank earnings and higher Chinese inflation. The CBOE Volatility Index fell to its lowest since June 2007.

Banks retreated the most after Wells Fargo, the largest US home lender, slipped 0.9 percent as fourth quarter mortgage applications declined and margins narrowed even as the bank took a bigger share of mortgage and commercial markets while betting on an economic revival.

Domestically, stock funds showed a huge inflow at the beginning of the year, the fourth largest since 1992. From a contrarian point of view, this rise in bullish sentiment could very well mark the end of the bullish cycle and trigger a sharp reversal.

Supporting that view was Paul Farrell’s piece titled “Washington ‘clowns’ set up 42% stock market drop.” While I don’t always agree with Paul’s viewpoint, much of what he wrote today goes along with my thinking.

The Dow Jones Industrial Average (DJIA) added 17 points to end at 13,488 while the S&P 500 Index (SPX) was nearly unchanged at 1,472, up 0.4 percent for the week. Treasury prices rose Friday, dragging the yields down from their highest level in eight months as worries over the country’s economy boosted demand for safe haven assets.

Meanwhile, the US dollar declined against the euro on Friday over optimism that the 17-member currency zone will return to growth by the end of this year. Good luck with that, as I have not seen any numbers in the recent past supporting an economic rebound in the Eurozone.

European equities witnessed a mixed trading session Friday as investors grew worried rising Chinese inflation will curb monetary easing by the nation’s central bank.

In Japan, the Cabinet Office said it would spend 10.3 trillion yen to drag the economy out of its third recession in five years. The stimulus is expected to create 600,000 jobs and increase domestic output by two percent, the statement added.

Our Trend Tracking Indexes (TTIs) headed higher and closed the week as follows:

Domestic TTI: +2.73% (last week +2.35%)

International TTI: +10.16% (last week +9.26%)

Earnings season will heat up next week and may provide more fuel to continue upward momentum, especially if Wall Street continues to ignore bad news while the late afternoon centrally planned lift-a-thon contributes the necessary assist to be sure equity indexes do not close in the red—no matter what.

Ulli…

————————————————————-

READER Q & A FOR THE WEEK

All Reader Q & A’s are listed at our web site!
Check it out at:

http://www.successful-investment.com/q&a.php

A note from reader Joyce:

Q: Ulli: How do you find Highs for a particular fund or ETF?

I was looking at your 7 ETF Model (12/31/2012) and I was just trying to figure out how all the numbers on the spreadsheet. I am not sure how you figure the number in High column.

The numbers I got from Yahoo Finance don’t match up with yours. For example, XLU and PPH all have had higher highs in previous year.

A: Joyce: If you buy an ETF or Mutual Fund, you are only concerned about the highs that are being made since your purchase date.

For the model portfolios, I use the highs since their rebalance date on 12/31/11. I track any changes on a daily basis and update the models as necessary. Once a dividend occurs, you need to reduce the high price by that amount. That’s why you could not match up my numbers.

———————————————————-

WOULD YOU LIKE TO HAVE YOUR INVESTMENTS PROFESSIONALLY MANAGED?

Do you have the time to follow our investment plans yourself? If you are a busy professional who would like to have his portfolio managed using our methodology, please contact me directly or get more details at:

https://theetfbully.com/personal-investment-management/

———————————————————

Back issues of the ETF/No Load Fund Tracker are available on the web at:

https://theetfbully.com/newsletter-archives/

ETF/No Load Fund Tracker Newsletter For Friday, January 11, 2013

Ulli ETF Tracker Contact

ETF/No Load Fund Tracker StatSheet

————————————————————-

THE LINK TO OUR CURRENT ETF/MUTUAL FUND STATSHEET IS:

https://theetfbully.com/2013/01/weekly-statsheet-for-the-etfno-load-fund-tracker-newsletter-updated-through-01102013/

————————————————————

Market Commentary

Friday, January 11, 2013

STOCK INDEXES FINISH HIGHER FOR THE SECOND STRAIGHT WEEK; EUROPEAN EQUITIES SLIP

US stock indexes changed little Friday, a day after the S&P 500 index rose to a five-year high as investors digested news of weak bank earnings and higher Chinese inflation. The CBOE Volatility Index fell to its lowest since June 2007.

Banks retreated the most after Wells Fargo, the largest US home lender, slipped 0.9 percent as fourth quarter mortgage applications declined and margins narrowed even as the bank took a bigger share of mortgage and commercial markets while betting on an economic revival.

Domestically, stock funds showed a huge inflow at the beginning of the year, the fourth largest since 1992. From a contrarian point of view, this rise in bullish sentiment could very well mark the end of the bullish cycle and trigger a sharp reversal.

Read More

Weekly StatSheet For The ETF/No Load Fund Tracker Newsletter – Updated Through 01/10/2013

Ulli ETF StatSheet Contact

ETF/Mutual Fund Data updated through Thursday, January 10, 2013

If you are not familiar with some of the terminology used, please see the Glossary of Terms.


1. DOMESTIC EQUITY MUTUAL FUNDS/ETFs: BUY — since 10/25/2011

The domestic TTI broke through its long-term trend line generating a Sell for this area effective 8/9/2011. Over the recent past, we’ve seen the TTI hovering slightly below and above this dividing line between bullish and bearish territory. The clear break to the upside occurred on 10/24/11 and, effective 10/25/11, a new Buy signal for domestic equities went into effect.

As of today, our Trend Tracking Index (TTI—green line in above chart) has bounced off its long term trend line (red) by +2.66% after recently having dipped slightly below it.

To avoid a potential whip-saw, a Sell signal to move out of all domestic equity positions will be generated once we have clearly pierced the line to the downside. Be sure to tune into my blog for the latest updates.

Read More

Chinese Export Data Lifts Equities; Europe Falters As ECB Keeps Rates On Hold

Ulli Market Commentary Contact

[Chart courtesy of MarketWatch.com]

US stocks advanced for a second straight day, sending the S&P 500 to a fresh five-year closing high after exports data from China bolstered the view the global economy is on the mend.

China’s December exports surged 14.1 percent from a year earlier, almost triple the 5 percent growth projected by analysts and well ahead of the 2.9 percent gain recorded in November. Imports also grew by a comparatively modest 6 percent from the final month of 2011, boosting trade surplus for December.

Investors also contemplated the latest labor market data that showed initial jobless claims rose 4000 to 371,000 in the latest week. A separate report showed inventories at US wholesalers grew by 0.6 percent in November, which was higher than economists had estimated.

None of these two items mattered as the indexes got their usual afternoon lift, which has been the theme for quite some time in this centrally planned market environment. Negative reports are ignored, and the indexes continue to rise with no regards to underlying fundamentals. It sure makes me wonder how long this can continue…

Read More