ETF/No Load Fund Tracker Newsletter For Friday, May 31, 2013
ETF/No Load Fund Tracker StatSheet
————————————————————-
THE LINK TO OUR CURRENT ETF/MUTUAL FUND STATSHEET IS:
https://theetfbully.com/2013/05/weekly-statsheet-for-the-etfno-load-fund-tracker-newsletter-updated-through-05302013/
————————————————————
Market Commentary
Friday, May 31, 2013
BEARS SHOW UP FOR THE SPANKING OF THE BULLS
It feels as if this is the beginning of a correction, as stocks ended the month of May with big losses, with the Dow Jones Industrial Average and Standard & Poor’s 500 Index posting their worst one-day drops since mid-April.
After moving between small losses and gains for most of the day, the stock market started to drift lower in afternoon trading. The sell-off accelerated in the final hour. The Dow lost 208 points (1.3%) to 15,116, the S&P 500 Index declined 24 points (1.4%) to 1,631, and the Nasdaq Composite descended 35 points (1.0%) to 3,456.
Today, there was both encouraging and disappointing news on the economy. Data showed consumer confidence advanced in May, improved 0.8 points to the highest level in almost six years. The full-month gain was 8.1 points, the most since October 2006. This argues for continued expansion in the current cycle.
Separate reports showed business activity rebounded this month after declining for the first time in more than three years in April, while consumer spending in the U.S. unexpectedly declined last month. Personal consumption expenditures fell 0.2% in April, down for the first time in nearly a year and by the most since September 2009. Economists expected a smaller 0.1% slip.
All ten sectors settled in the red as two defensive groups, consumer staples and health care, led to the downside. Consumer staples endured selling pressure throughout the week, as the group declined 3.2%, which erased its May gain.
Elsewhere, the health care sector fell 2.2% and trimmed its year-to-date gain to 20.1%, surrendering its spot atop this year’s sector leader board to financials. Even with today’s 1.6% loss, the financial sector ended the week with a gain of 5.9%. Technology stocks also enjoyed a strong week, but unlike financials, the group held up relatively well through the selloff.
The European equity markets finished lower, pulling back to three-month lows, in the wake of a plethora of economic reports in the region, while digesting record high euro zone unemployment.
Stocks finished to the downside amid a volatile week of mixed data and uncertainty regarding the Federal Reserve tapering off its asset purchases. For the week, the Dow fell 1.2 percent, the S&P 500 lost 1.1 percent and the Nasdaq dipped 0.1 percent.
For the month of May, the Dow rose 1.9 percent and the Nasdaq gained 3.8 percent. Economic data fostered mixed reactions. Meanwhile, a lowered global growth outlook from the Organization for Economic Cooperation and Development added to the wild ride for the markets this week.
And last not least, Japanese markets added to the volatile theme, with the Nikkei 225 Index posting a more than 5% one-day drop. What’s next: Correction, pullback or crash?
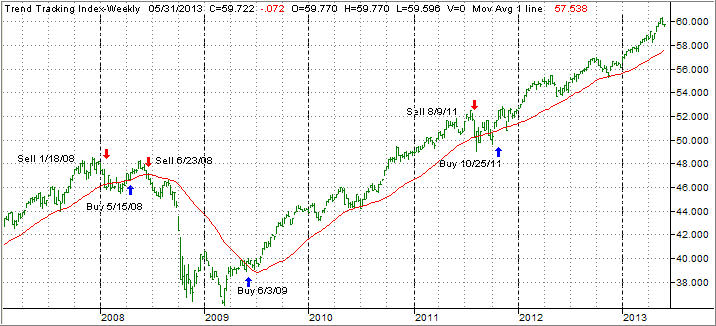
As I have posted repeatedly, we are in unchartered territory due to the Fed’s reckless policies so anything is possible. That’s why it’s important to stay with the major trend until it reverses at which time our sell stops will point the way to the exit door. Some of our holdings are getting close but none were triggered.
Our Trend Tracking Indexes (TTIs) headed south as well and ended the week as follows:
Domestic TTI: +3.06% (last week +4.08%)
International TTI: +6.50% (last week +8.29%)
Have a great week.
Ulli…
————————————————————-
READER Q & A FOR THE WEEK
All Reader Q & A’s are listed at our web site!
Check it out at:
http://www.successful-investment.com/q&a.php
A note from reader Freden:
Q: Ulli: Thanks again for your wonderful site and amazing information…With the craziness in the markets, it is good to have a voice of reason. My question is this: Most portfolio allocations recommend a percentage of bonds – roughly 35% to be fully diversified. With BWX now well below your 5% sell stop recommendation would you sell it? How about BND if it drops below 5%?
A: Freden: Yes, in fact, I liquidated BWX in our Model ETF portfolio, as it had triggered its 5% trailing sell stop. While BND is still a hold, it may be next on the chopping block. Worries about higher interest rates persist, and we may very well see the bonds move into bear market territory before the stock market does.
In any event, I just simply let my trailing sell stops tell me when it’s time to step aside.
———————————————————-
WOULD YOU LIKE TO HAVE YOUR INVESTMENTS PROFESSIONALLY MANAGED?
Do you have the time to follow our investment plans yourself? If you are a busy professional who would like to have his portfolio managed using our methodology, please contact me directly or get more details at:
https://theetfbully.com/personal-investment-management/
———————————————————
Back issues of the ETF/No Load Fund Tracker are available on the web at:
https://theetfbully.com/newsletter-archives/

 The ETF universe continues to massively grow not only in asset size but also in number of funds. There are now almost 1,500 ETFs available with total assets of over $1.5 trillion.