ETF/No Load Fund Tracker Newsletter For Friday, July 12, 2013
ETF/No Load Fund Tracker StatSheet
————————————————————-
THE LINK TO OUR CURRENT ETF/MUTUAL FUND STATSHEET IS:
https://theetfbully.com/2013/07/weekly-statsheet-for-the-etfno-load-fund-tracker-newsletter-updated-through-07112013/
————————————————————
Market Commentary
Friday, July 12, 2013
VOLATILE FRIDAY BUT STOCKS END WEEK IN RECORD HIGH
U.S. equities ended the week in volatile fashion but managed to advance for a seventh day, extending a record for the Standard & Poor’s 500 Index, despite head winds for Boeing and United Parcel Service, a downgrade of France’s credit rating and disappointing U.S. economic data.
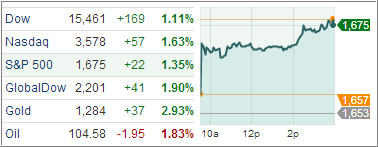
The Dow Jones Industrial Average closed 3 points higher at 15,464, the S&P 500 Index increased 5 points (0.3%) to 1,680, and the Nasdaq Composite gained 22 points (0.6%) at 3,600.
Quarterly earnings were in focus this morning after Dow member JPMorgan Chase & Co and Wells Fargo & Co both reported stronger-than-forecasted results, while UPS released 2Q earnings guidance that missed estimates. Both banks reported bottom-line beats on in-line revenues.
However, JPMorgan Chase saw a 7.0% quarter-over-quarter decrease in mortgage originations while Wells Fargo reported a 2.7% increase. The results provided support for other bank shares, and the financial sector settled atop the sector leader board with a gain of 0.5%. Discretionary shares also outperformed the broader market as online retailers displayed strength. However, there were negatives as well.
On the downside, the industrial sector was pressured by the underperformance of two large components. United Parcel Service fell 5.8% after issuing cautious second quarter and full year earnings guidance due to a slowing U.S. industrial economy.
In addition, Dow component Boeing tumbled on heavy volume after a fire took place aboard a 787 Dreamliner at London’s Heathrow Airport. Shortly after the news broke, separate reports indicated a Florida-bound 787 was forced to return to its home port in Manchester, U.K. due to a technical issue. The materials sector also finished among the laggards after pacing yesterday’s advance.
Today’s economic data revealed the largest increase in producer prices since September 2012 due to an unexpected jump in energy prices. The Producer Price Index rose 0.8% in June and more than the consensus of 0.5%. Energy prices rose 2.9%, led by gasoline. Food prices advanced 0.2%.
Elsewhere, Consumer Sentiment Index slipped 0.2 points to 83.9 in the preliminary July reading, contrary to expectations for a slight uptick to 84.7. Even so, the index remains near its highest level since the summer of 2007, and its six-month average continues to advance, indicating a positive trend in sentiment.
For the week, the S&P 500 scored its best weekly performance since January and a third consecutive week of gains. The S&P 500 gained 3 percent, while the Dow rose 2.2 percent and the Nasdaq climbed 3.5 percent. The continuation of the upward trend came courtesy of Dow member Alcoa unofficially kicking off 2Q earnings season in positive fashion, while concerns about an expedited pullback in stimulus measures eased.
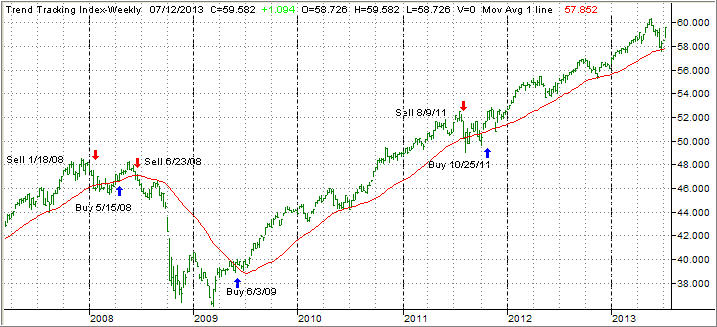
Our Trend Tracking Indexes (TTIs) closed the week as follows:
Domestic TTI: +3.13% (last week +1.24%)
International TTI: +6.29% (last week +3.70%)
Have a great week.
Ulli…
————————————————————-
READER Q & A FOR THE WEEK
All Reader Q & A’s are listed at our web site!
Check it out at:
http://www.successful-investment.com/q&a.php
A note from reader Jeff:
Q: Ulli: Just wondering when you were going to add new positions to your model portfolios?
A: Jeff: Either on a trend line break to the upside or, once the old highs, from which the sell stops are calculated, have been taken out. I described that in my latest e-book. In case you missed it, you can download it here.
———————————————————-
WOULD YOU LIKE TO HAVE YOUR INVESTMENTS PROFESSIONALLY MANAGED?
Do you have the time to follow our investment plans yourself? If you are a busy professional who would like to have his portfolio managed using our methodology, please contact me directly or get more details at:
https://theetfbully.com/personal-investment-management/
———————————————————
Back issues of the ETF/No Load Fund Tracker are available on the web at:
https://theetfbully.com/newsletter-archives/

 We have to look at the minutes and the question-answer portion of his presentation that he gave a couple of hours later in Boston as part of the NBER summer institute separately, says Brian Jacobsen, Chief Portfolio Strategist at Wells Fargo Fund Management.