ETF/No Load Fund Tracker Newsletter For Friday, July 19, 2013
ETF/No Load Fund Tracker StatSheet
————————————————————-
THE LINK TO OUR CURRENT ETF/MUTUAL FUND STATSHEET IS:
https://theetfbully.com/2013/07/weekly-statsheet-for-the-etfno-load-fund-tracker-newsletter-updated-through-07182013/
————————————————————
Market Commentary
Friday, July 19, 2013
TECH GIANTS DRAG STOCKS TO MIXED ENDING
On the heels of the Dow and S&P setting new highs yesterday, the U.S. equity markets experienced a lackluster trading session that wavered to a mixed finish today following weak earnings reports in the tech sector. The market also racked up a split decision for the week.
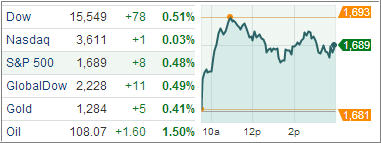
The Dow Jones Industrial Average closed 5 points lower at 15,544, the Standard & Poor’s 500 Index gained 3 points (0.2%) to 1,692, and the Nasdaq Composite lost 24 points (0.7%) to 3,588.
On a day without any major economic releases, corporations’ earning reports took the stage. Technology shares displayed weakness across the board, while the broader market was kept afloat by the outperformance of heavily-weighted energy, health care, and industrial sectors.
Today’s session featured disappointing earnings from technology heavyweights, Google and Microsoft. Microsoft led the slump in tech by plunging 11 percent, which was the most in more than four years after the company wrote off nearly $1 billion on its new tablet computer and reported declining revenue for its Windows operating system. Google dropped after its revenue fell below analysts’ forecasts, partly because the Internet search leader’s ad prices took an unexpected turn lower.
Meanwhile, Dow member General Electric posted stronger-than-forecasted earnings. The stock surged 4.6 percent to the highest in almost five years, pacing gains among industrial shares. Honeywell International and Chipotle Mexican Grill also reported earnings that beat the Street’s expectations.
The health care sector spent the entire session in a steady climb as biotechnology provided significant support. Energy sector advanced 1.4% on the back of better-than-expected earnings from Schlumberger. On a related note, crude oil added 0.3% to $108.15. Another commodity-related sector, materials, rose 0.5%. Gold futures displayed strength as well, climbing 0.8% to $1294.30 per troy ounce. How did the overall market perform this week?
Heading into the weekend, the S&P 500 and the Dow climbed 0.7% and 0.5%, respectively. Both rose for the fourth straight week while the Nasdaq slipped 0.3%. This week’s domestic economic calendar yielded some mixed reports.
Growth in manufacturing activity in the New York and Philadelphia regions unexpectedly accelerated for July, jobless claims fell more than expected, and homebuilder sentiment posted the strongest reading since January 2006. Meanwhile, June retail sales were softer than anticipated, housing starts and building permits both dropped, and Leading Indicators came in flat.
However, none of this mattered with the Dow and S&P 500 hitting all-time highs during the week, as 2Q earnings season continued to be relatively positive and economic sentiment was reiterated by Fed Chief Bernanke that given its employment and inflation outlooks, “a highly accommodative monetary policy will remain appropriate for the foreseeable future.”
Our Trend Tracking Indexes (TTIs) closed the week as follows:
Domestic TTI: +3.47% (last week +3.13%)
International TTI: +6.76% (last week +6.29%)
Have a great week.
Ulli…
————————————————————-
READER Q & A FOR THE WEEK
All Reader Q & A’s are listed at our web site!
Check it out at:
http://www.successful-investment.com/q&a.php
A note from reader Larry:
Q: Ulli: Your new E-Book is interesting, but I have one question based on your following statements:
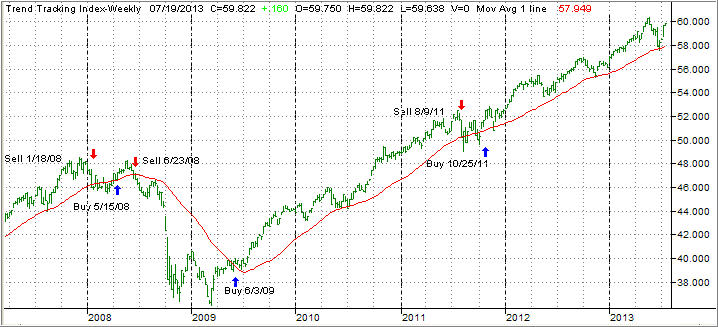
A “Buy” signal for SPY is generated once the current price of SPY has crossed its 39-week SMA and has closed above it for 3 consecutive days. Once that has happened, our purchase will be executed on the 4th day at the closing price.
A “Sell” signal to close out the position will be generated once the current price closes below its 39-week SMA. Once that happens, we will sell the next day at the closing price.
I understand the 4th day to buy after the 39 week SMA has been crossed to the upside, but what about selling as it appears that you are instructing one to sell on the second day that the 39 week SMA is crossed to the downside, but what do you recommend if on the second day the market goes up strongly would you do a wait and see, please clarify the selling rules under that scenario.
A: Larry: Yes, you are absolutely correct. Before I execute any buy/sell order, I check market activity to be sure that a major reversal is not in the making. If it is, I hold off another day—that’s where active management comes in. For testing purposes in this research project, we did not make any management decisions but went straight for the execution.
———————————————————-
WOULD YOU LIKE TO HAVE YOUR INVESTMENTS PROFESSIONALLY MANAGED?
Do you have the time to follow our investment plans yourself? If you are a busy professional who would like to have his portfolio managed using our methodology, please contact me directly or get more details at:
https://theetfbully.com/personal-investment-management/
———————————————————
Back issues of the ETF/No Load Fund Tracker are available on the web at:
https://theetfbully.com/newsletter-archives/

 In his latest congressional testimony and the following Q&A session, Federal Reserve Chairman Ben Bernanke tried to distinguish between tapering and tightening and underlined the degree of conditionality that really relates to tapering, says Jeremy Stretch, Head of Currency Strategy at the Canadian Imperial Bank of Commerce.