Ignoring Weakness In Jobs Data

Ulli Market Commentary Contact

Tue pic

[Chart courtesy of MarketWatch.com]

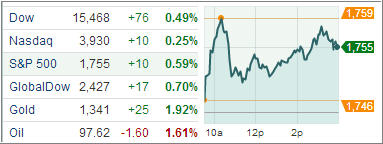
U.S. equities finished higher, despite a softer-than-forecasted U.S. September nonfarm payroll report. The data may have solidified expectations that the Federal Reserve may hold off on tapering its asset purchases until signs of a healthy economy become more lucid.

Speculation pushed the annual advance in the Standard & Poor’s 500 Index within a percentage point of the best yearly gain in a decade. Treasuries finished solidly higher following the jobs report, overshadowing positive reads on construction spending and manufacturing activity in the Mid-Atlantic region. Gold was higher, while crude oil prices and the U.S. dollar lost ground.

Earnings reports continue to come in earnest, with mostly positive results. Netflix beat earnings expectations, as did Texas Instruments, but the chipmaker’s shares suffered after it issued disappointing 4Q guidance. Moreover, Dow member Travelers Companies bested the Street’s projections and authorized a $5 billion stock buyback plan, and Dow member DuPont reported upbeat earnings.

Read More

Earnings In Focus Ahead Of Jobs Data

Ulli Market Commentary Contact

Mon pic

[Chart courtesy of MarketWatch.com]

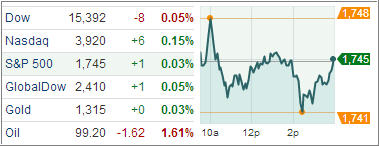
U.S. equities finished mixed and near the flatline in a choppy session, as investors await a week chock full of earnings and economic data, headlined by tomorrow’s release of the September nonfarm payroll report.

Meanwhile, the Dow was pressured by McDonald’s disappointing same-store sales and lackluster guidance which overshadowed its better-than-expected 3Q earnings. In other equity news, Dow member JPMorgan Chase & Co reportedly reached a $13 billion civil settlement with the U.S. government, fellow Dow component AT&T agreed to sell or lease 9,700 wireless towers to Crown Castle International for $4.85 billion in cash, RadioShack reportedly secured new financing, and Netflix posted better-than-expected 3Q results after the close.

Elsewhere, treasuries were lower following a decline in U.S. existing home sales, while gold and crude oil prices were lower, and the U.S. dollar was flat.

Read More

ETFs/Mutual Funds On The Cutline – Updated Through 10/18/2013

Ulli ETFs on the Cutline Contact

Below are the latest ETF Cutline reports, which show how far above or below their respective long-term trend lines (39 week SMA) my currently tracked ETFs/MFs are positioned.

The first report covers the ETF Master List from Thursday’s StatSheet and includes 398 ETFs, of which currently 342 (last week 327) are hovering in bullish territory.

The second report includes only High Volume ETFs. To clarify, High Volume (HV) ETFs are defined as those with an average daily volume of $10 million or higher.

These ETFs are generated from my selected list of some 93 that I use in my advisor practice. It cuts out the “noise,” which simply means it eliminates those ETFs that I would never buy because of their volume limitations. 75 ETFs (last week 69) have managed to remain in bullish territory after the recent market volatility.

The third report covers Mutual Funds on the Cutline. There are currently 818 (last week 800) above the line and 41 below it out of the 859 that I follow.

Take a look:

1. ETF Master Cutline Report     

2. ETF High Volume Cutline Report

3. MF Cutline Report

In case you are not familiar with some of the terminology used in the reports, please read the Glossary of Terms.

If you missed the original post about the Cutline approach, you can read it here.

One Man’s Opinion: Do Economic Indicators Support Tapering Next Year?

Ulli Market Review Contact

92835431It’s not a matter of if the Fed will pull back, but a matter of when the Fed decides to pull back and taper QE, said Joseph Stanious, market strategist at JPMorgan Funds. Hoping for the tapering to start this year is probably not going to be correct as the Fed is yet to assess the damage that Washington caused to the economy but it may happen by early next year, by January the earliest under new Fed chief Janet Yellen.

The underlying indicators that the Fed has been watching all along such as job market strength and economic growth are all intact and support tapering, Joe said. The financial sector has been on a tear this past year, gaining more than 27 percent and really leading the S&P on some kind of rallies.

But the real worries are still mounting as the earnings-season progresses, with the quality of earnings coming under investors’ focus. Bank of America’s profits seem to have come from lower legal expenses rather than interest margins. Revenue from trading has also dropped, especially in the fixed-income segment with Goldman Sachs faring the worst since the financial crisis in 2008. Also, stagnant loan growth seems to be another problem for the banks.

Read More

New ETFs On The Block: Flexshares STOXX Global Broad Infrastructure Index Fund (NFRA)

Ulli Infastructure ETFs Contact

123508402Infrastructure and natural resources have found favor with investors in recent years, and a flurry of funds have been issued to capitalize on the rapid development in emerging markets such as China, India and Brazil.

The prospect for this space looked very bright a few years ago after Brazil was awarded the 2014 Soccer World Cup and 2016 Olympics and India announced it will spend more than $1 trillion to build new infrastructures. The performance of this sector however, remained mixed with broad-based funds such as the iShares Global Infrastructure ETF (IGF) trading like defensive funds, and the emerging market funds exhibiting more volatility than their developed-market counterparts.

Nevertheless, infrastructure across many developed countries, including the US, needs to be upgraded and with the US Fed likely to continue with its loose monetary policy till growth picks up, firms in this niche are expected to remain busy for a long time.

Read More

10-18-2013

Ulli Newsletter Archives Contact

ETF/No Load Fund Tracker Newsletter For Friday, October 18, 2013

ETF/No Load Fund Tracker StatSheet

————————————————————-

THE LINK TO OUR CURRENT ETF/MUTUAL FUND STATSHEET IS:

https://theetfbully.com/2013/10/weekly-statsheet-for-the-etfno-load-fund-tracker-newsletter-updated-through-10172013/

————————————————————

Market Commentary

Friday, October 18, 2013

EARNINGS INSPIRE MARKETS

Domestic equity markets were solidly higher to end the week with the S&P hitting a fresh record high, as better-than-expected earnings results from Google, Morgan Stanley, and General Electric overshadowed Honeywell’s quarterly revenue missing expectations.

Elsewhere, a plethora of upbeat Chinese economic data helped to buoy sentiment, highlighted by the first acceleration in GDP growth in three quarters. The Dow Jones Industrial Average closed 27 points higher (0.2%) at 15,399, the S&P 500 Index registered its third consecutive gain, rising 11 points (0.7%) to 1,744, and the Nasdaq Composite increased 51 points (1.3%) to 3,914.

Google made a significant contribution to the relative strength of the tech-heavy index. Shares of Google surged 13.8% after the company surpassed earnings expectations by 37 cents. Thanks to Google’s surge, the tech sector settled in the lead with a gain of 1.8%. Even though the sector ended sharply higher, some other top members underperformed. Qualcomm shed 0.4% and IBM fell 0.6% after plunging 6.4% yesterday. Outside of technology, the industrial sector (+1.1%) was the only group that ended with a gain larger than 1.0%.

Top sector component General Electric jumped 3.5% after beating earnings expectations on a 1.5% year-over-year decline in revenue. Transports also contributed to the sector’s strength as the Dow Jones Transportation Average advanced 1.2%.

Elsewhere, the energy space (+0.9%) outperformed. Also of note, the financial sector (+0.3%) underperformed even as Morgan Stanley rose 2.6% after beating on earnings and revenue. JPMorgan Chase received a late-afternoon boost off its lows amid reports of the bank reaching a $4 billion settlement with the Federal Housing Finance Agency. On the downside, the health care space (-0.4%) ended in the red. The iShares Nasdaq Biotechnology ETF lost 0.8%.

Economists estimated that the 16-day government shutdown government reduced growth by 0.3 percentage point this quarter. The slower growth and delayed reporting of economic data will prevent Fed policy makers from paring the monthly pace of asset buying until their March 18-19 meeting.

Treasuries were nearly unchanged today on the heels of an economic calendar that was void of any major releases, while data that had been postponed due to the government shutdown is slated to be released starting next week.

Meanwhile, crude oil gained ground, while gold saw pressure and the U.S. dollar was nearly unchanged. Finally, for the week, the Dow rose 1 percent, the S&P was up 2.4 percent and the Nasdaq advanced 3.2 percent.

Our Trend Tracking Indexes (TTIs) headed higher as well and closed the week as follows:

Domestic TTI: +4.50% (last week +3.01%)

International TTI: +8.17% (last week +6.41%)

Have a great week.

Ulli…

————————————————————-

READER Q & A FOR THE WEEK

All Reader Q & A’s are listed at our web site!
Check it out at:

http://www.successful-investment.com/q&a.php

A note from reader Bill:

Q: Ulli: On 9-6-13, FOCPX dropped 8.8% about $6.66 per share. I called a Fidelity rep and he said because Apple fell 9-10% and FBIOX also declared and paid a Capital Gain and Dividend of around $1.189 per share, but it’s sort of floundering around not moving and actually down three days in a row for the last three days.

I guess my question is, are people getting out because of that drop and should I get out also?

I understand when a lot of people get out of a fund they have to sell off and that makes the fund drop.

A: Bill: Here’s how I look at it:

FOCPX made a high of 80.84 on 8/5/13, which would be the number to use for your trailing sell stop. Say, 7.5% of that high would put a sell signal at a break below 74.78, which happened only briefly before this fund recovered. I could not verify the distribution of $1.19.

If that is in fact correct, you need to reduce the high price by that amount, which would make the new high $79.65. Now you calculate the sell stop point of 7.5%, which brings it down to $73.68, which has not been reached yet.

That’s the process I go through to determine if a stop has been triggered. If it has, I will execute the next day, unless there is a huge rebound in the making.

Hope that clarifies your thinking.

———————————————————-

WOULD YOU LIKE TO HAVE YOUR INVESTMENTS PROFESSIONALLY MANAGED?

Do you have the time to follow our investment plans yourself? If you are a busy professional who would like to have his portfolio managed using our methodology, please contact me directly or get more details at:

https://theetfbully.com/personal-investment-management/

———————————————————

Back issues of the ETF/No Load Fund Tracker are available on the web at:

https://theetfbully.com/newsletter-archives/