 The ETF/No Load Fund Tracker
Monthly Review—July 31, 2013
US Equities Finish July Higher On Fed Talk, Europe Rallies On Better Economic Readings
US stocks finished higher in July with all equity indexes hitting new highs as the Federal Reserve refrained from giving any hint on a potential September-taper or changes to its monetary policy after its latest FOMC meeting last week.
The Federal Open Market Committee kept its monthly bond purchase program unchanged at $85 billion after a two-day meeting in Washington on Wednesday and noted the economy was expanding at a ‘modest’ pace, a change from the ‘moderate’ pace seen in June. The committee however, said it expects growth to pick up from the recent pace and warned inflation below the Fed’s targeted 2 percent could risk the economy’s performance.
Analysts believe the central bank has taken greater recognition of a deflation risk, which stopped it from giving out any hint on tapering. The blue-chip Dow Jones Industrial Average ended the month up 4 percent, marking its eighth monthly rise in nine. The S&P 500 index posted a 5 percent monthly gain while the tech-laden NASDAQ Composite advanced 6.6 percent for July, registering its best monthly performance since January 2012.
On the flip-side, the all-important nonfarm payrolls data for July came in at 162,000 – the smallest gain in four months, and was well below the downwardly revised 188,000 recorded in June. The disappointing number fell short of the 175,000-185,000 gain forecasted by most economists.
Though unemployment rate declined to 7.4 percent in July from 7.6 percent in June, a fall in labor participation rate to 63.4 percent from June’s rate of 63.5 percent contributed to about half of the decline.
Separately, a Commerce Department report showed the US economy grew at a 1.7 percent annual pace in the second quarter, surpassing market expectations and coming in well ahead of a downwardly revised 1.1 percent growth rate for the first quarter. Business investment surged 9 percent in the second quarter while consumer spending rose 1.8 percent, helping offset a 9.5 jump in imports – a negative for the economy.
Economists agree mixed data continued to pose challenges for the Fed since it needs to start trimming its balance sheet, but remains unsure if the apparent pickup in growth is sustainable.
Meanwhile, European equities rallied as the region’s economy showed signs of revival. The pan-European Stoxx Europe 600 index finished July 5.1 percent higher, posting its biggest monthly gain since October 2011.
Economic data from Europe’s largest economy Germany continued to be mixed. While jobless claims fell surprisingly in July and unemployment rate remained stable near a record 6.8 percent, retail sales for June slipped 1.5 percent.
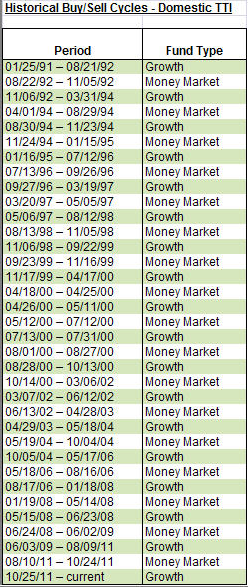
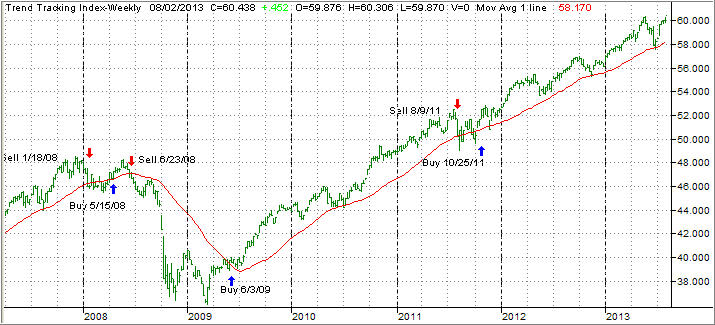
The major trend remains bullish, and our main indicator, the Domestic Trend Tracking Index (TTI), currently resides +3.90% above its long term trend line (red) as the chart shows:
With the Fed being the major driver to promote the relentless upward trend while, at the same time, defending any downward bias, at least for the time being, equity ETFs remain the place to be invested in. While bond ETFs bounced off their June bottom, they are still stuck below their long term trend lines and therefore in bear market territory.
We added SPY (S&P 500 index) to our holdings the middle of July after it had become clear that June’s sharp selloff appeared not to be the major correction I had been looking for but merely a temporary pullback.
We continue our cautious exposure knowing that at anytime some unintended consequences of the Fed’s monetary policy can backfire and bring this bull to its knees in a hurry. All of our sell stops are identified and will be executed should the need arise.