ETF/No Load Fund Tracker Newsletter For Friday, September 20, 2013
ETF/No Load Fund Tracker StatSheet
————————————————————-
THE LINK TO OUR CURRENT ETF/MUTUAL FUND STATSHEET IS:
https://theetfbully.com/2013/09/weekly-statsheet-for-the-etfno-load-fund-tracker-newsletter-updated-through-09192013/
————————————————————
Market Commentary
Friday, September 20, 2013
STOCKS SHIFT INTO RETREAT MODE AS BUDGET BATTLE BEGINS
U.S. equity markets closed the trading session solidly lower, erasing some of the recent gains, which stemmed from the Street’s initial reaction to the surprising Fed announcement that the Central Bank will keep its stimulus measures at the current pace.
The U.S. economic calendar was void of any major releases today. Meanwhile, Treasuries were higher amid the Fed and fiscal uncertainty, while lawmakers began their budget battle on Capitol Hill. The Dow Jones Industrial Average closed 186 points lower (1.2%) at 15,451, the S&P 500 Index ended down 13 points (0.7%) at 1,710, and the Nasdaq Composite decreased 15 points (0.4%) to 3,775.
The major indices spent the entire session in a steady retreat off their opening levels with industrials and materials leading to the downside. Sellers remained in control throughout the day amid divisive headlines from Washington. Although all ten sectors ended in the red, nine finished the week with a gain while today’s weakest performer (telecom services) closed the week flat.
Elsewhere, the industrial sector (-1.4%) weighed on the broader market as defense contractors lagged as broader PHLX Defense Index fell 1.7%. The Market Vectors Steel ETF slid 2.2%. Miners lagged as gold fell 3.2% to $1,326.10 per troy ounce. The Market Vectors Gold Miners ETF tumbled 5.9%.
With the stock market ending on its lows, only financials (-0.5%) and health care (-0.2%) outperformed while technology (-0.7%) and discretionary shares (-0.7%) ended in-line. On the equity front, shares of BlackBerry Limited were under heavy pressure after the smart phone maker announced disappointing preliminary 2Q results and that it will be reducing its workforce by approximately 4,500. The stock plunged 17.1%.
This week, the Dow and S&P 500 reached record highs and bond yields came under pressure as the Federal Reserve surprised the markets by holding off on beginning the process of normalizing monetary policy. The Fed also downgraded its outlook for the economy.
So far now, September defied the worriers. The stock market has bounced backed from an August swoon, despite a calendar loaded with potential rally killers. Fears of a conflict with Syria have faded; and, as Middle East strife recedes from investors’ minds, though, fears of budget gridlock grow. Even with today’s decline, the S&P 500 index is up 4.8 percent for the month.
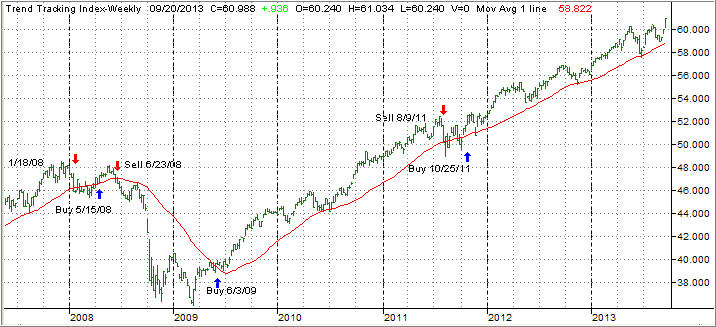
Our Trend Tracking Indexes (TTIs) headed higher as well and closed the week as follows:
Domestic TTI: +3.43% (last week +2.29%)
International TTI: +7.70% (last week +6.15%)
Have a great week.
Ulli…
————————————————————-
READER Q & A FOR THE WEEK
All Reader Q & A’s are listed at our web site!
Check it out at:
http://www.successful-investment.com/q&a.php
A note from reader Bill:
Q: Ulli: On 9-6-13, FOCPX dropped 8.8% about $6.66 per share. I called a Fidelity rep and he said because Apple fell 9-10% and FBIOX also declared and paid a Capital Gain and Dividend of around $1.189 per share, but it’s sort of floundering around not moving and actually down three days in a row for the last three days.
I guess my question is, are people getting out because of that drop and should I get out also?
I understand when a lot of people get out of a fund they have to sell off and that makes the fund drop.
A: Bill: Here’s how I look at it:
FOCPX made a high of 80.84 on 8/5/13, which would be the number to use for your trailing sell stop. Say, 7.5% of that high would put a sell signal at a break below 74.78, which happened only briefly before this fund recovered. I could not verify the distribution of $1.19.
If that is in fact correct, you need to reduce the high price by that amount, which would make the new high $79.65. Now you calculate the sell stop point of 7.5%, which brings it down to $73.68, which has not been reached yet.
That’s the process I go through to determine if a stop has been triggered. If it has, I will execute the next day, unless there is a huge rebound in the making.
Hope that clarifies your thinking.
———————————————————-
WOULD YOU LIKE TO HAVE YOUR INVESTMENTS PROFESSIONALLY MANAGED?
Do you have the time to follow our investment plans yourself? If you are a busy professional who would like to have his portfolio managed using our methodology, please contact me directly or get more details at:
https://theetfbully.com/personal-investment-management/
———————————————————
Back issues of the ETF/No Load Fund Tracker are available on the web at:
https://theetfbully.com/newsletter-archives/