
- Moving the market
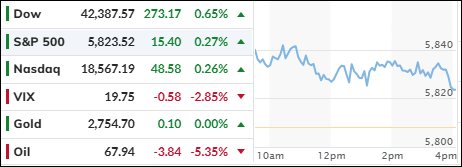
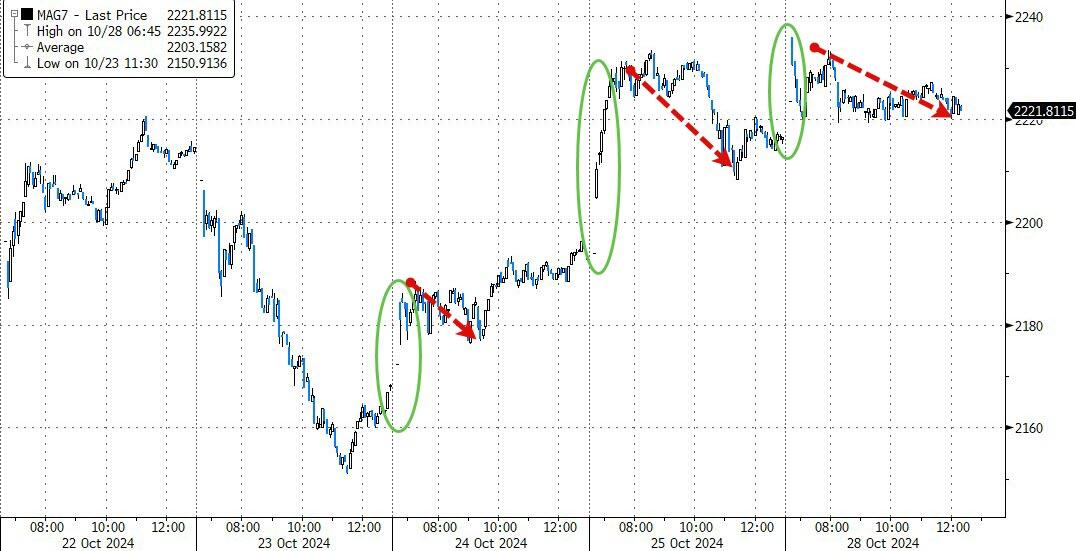
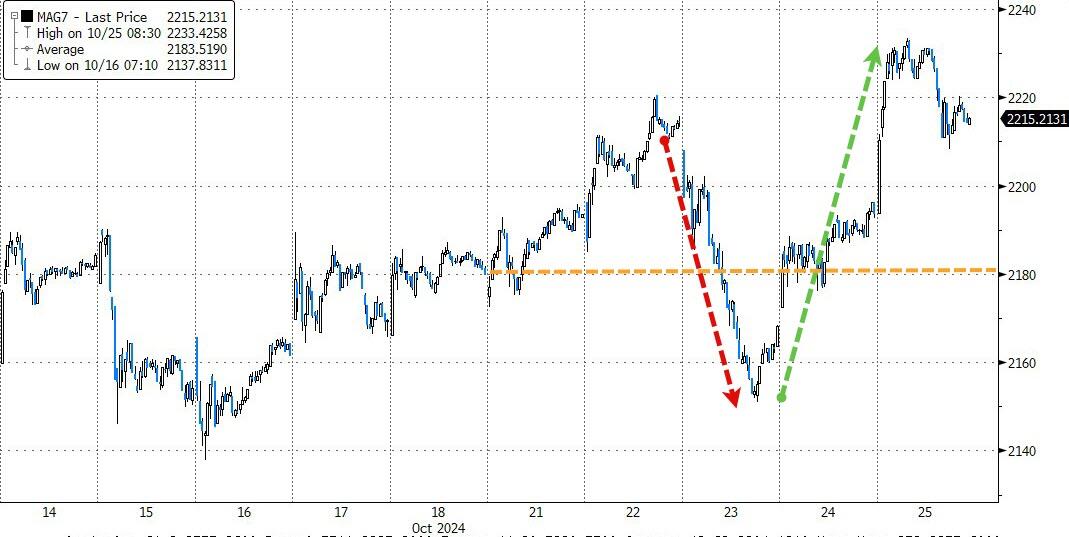
Early in the trading session, bullish sentiment dominated despite a flood of mixed earnings results, with more reports expected from major tech companies.
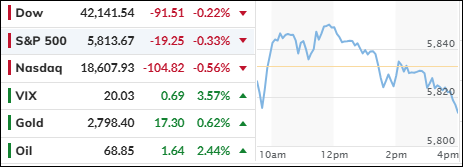
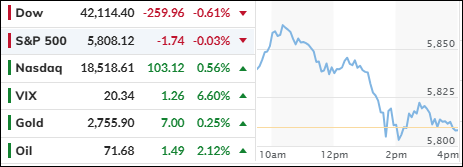
However, this optimism was short-lived, as the major indexes eventually succumbed to bearish pressures, relinquishing their gains, and closing in the red.
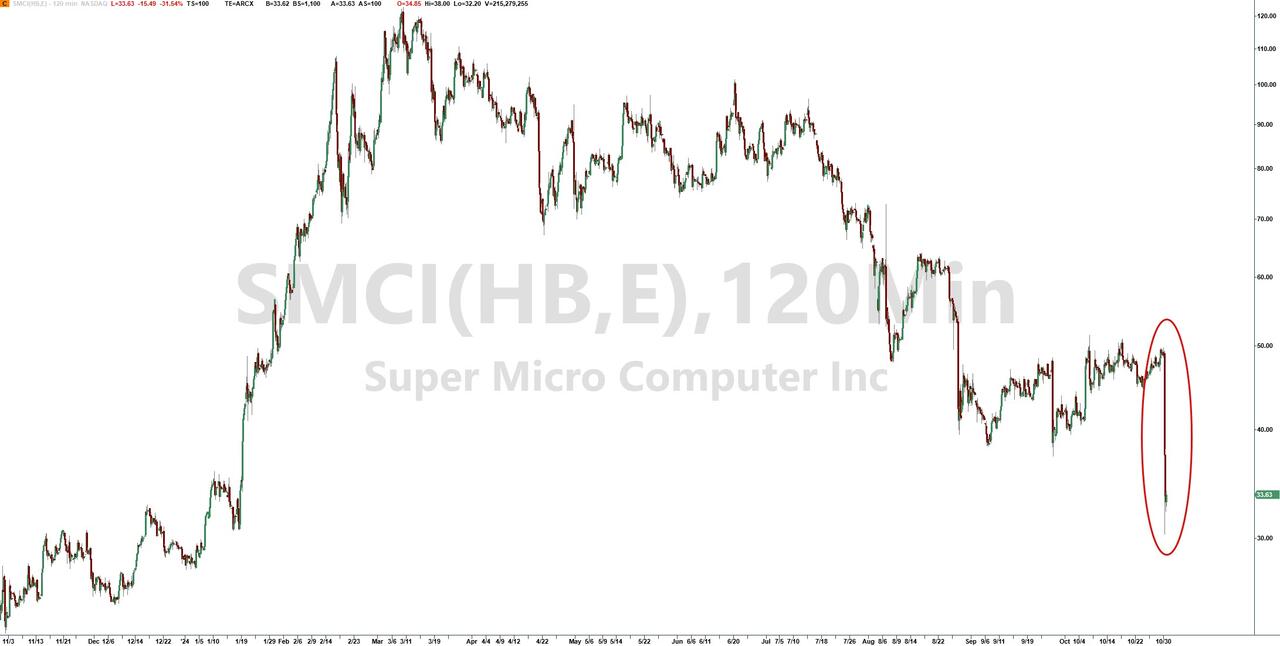
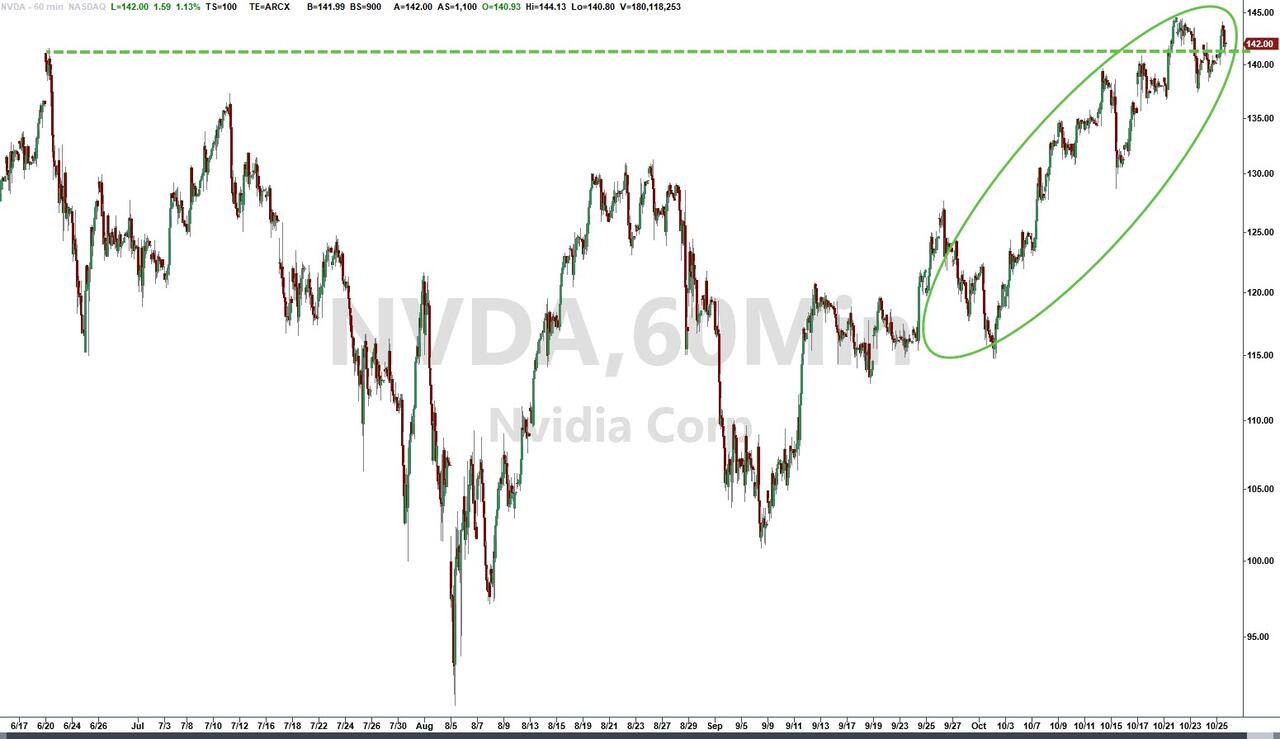
Alphabet set a positive tone by surpassing expectations, boosting its share price by approximately 6%. In contrast, chipmaker AMD disappointed investors, leading to a 10% drop in its stock. Super Micro had an even worse day, with its stock plummeting by 32%, while Caterpillar also underperformed, losing 4% of its value.
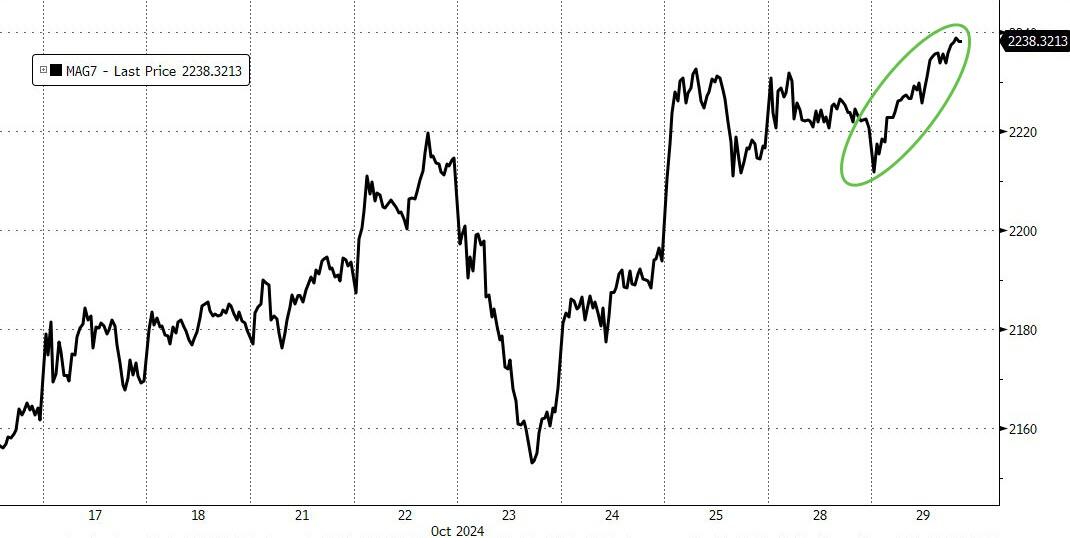
As the market closed, anticipation grew for the earnings reports from tech giants Meta and Microsoft, with Apple and Amazon scheduled to release their results the following afternoon.
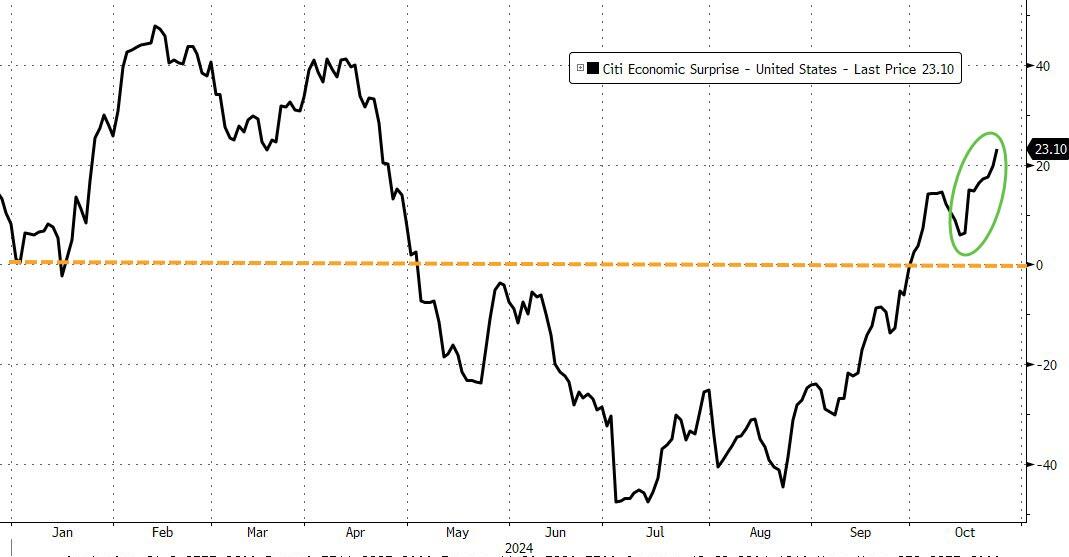
On the economic front, the latest third-quarter GDP figure showed a 2.8% annualized increase, falling short of economists’ expectations of a 3.1% rise.
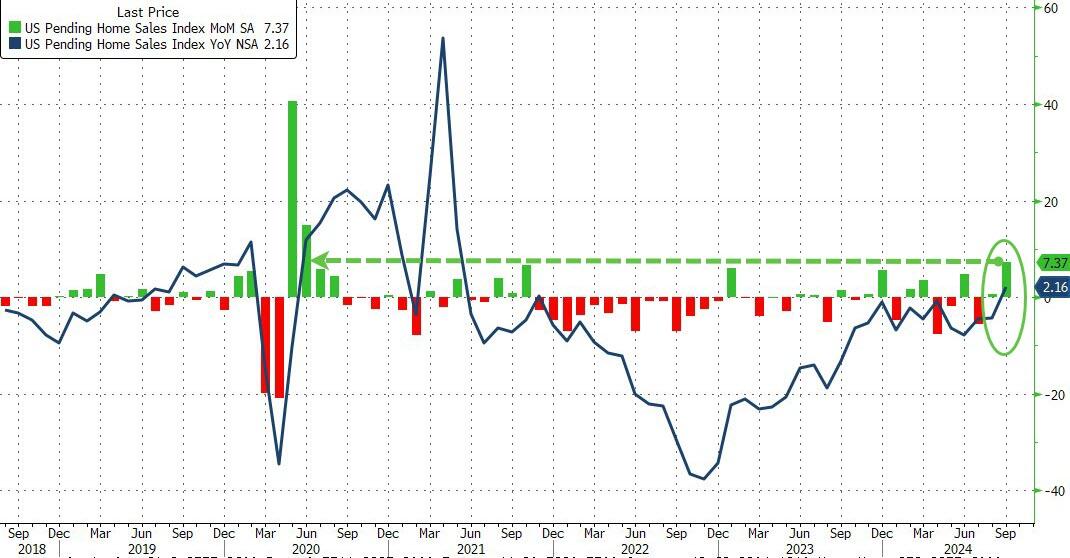
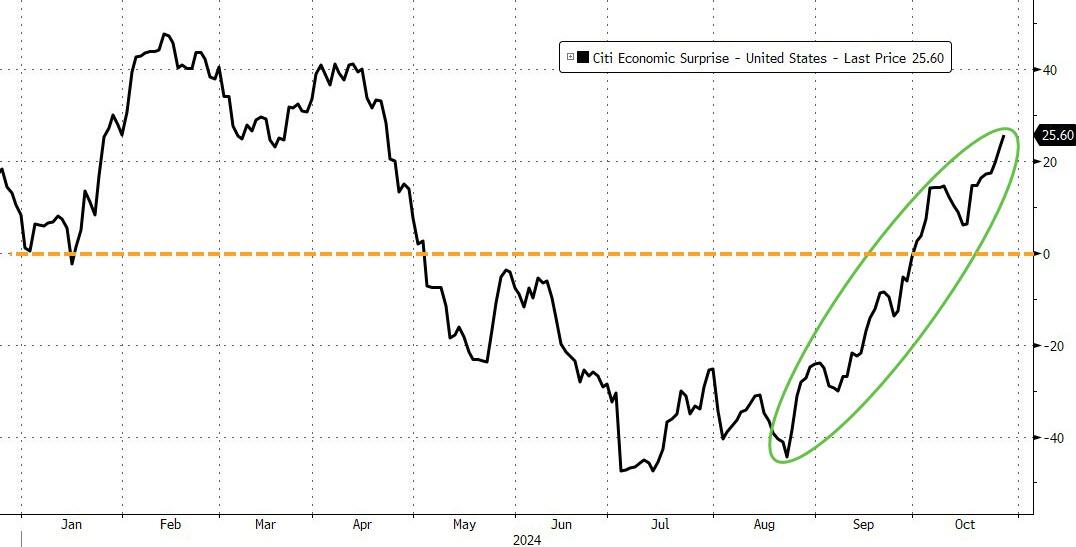
However, the ADP payroll report provided a silver lining, revealing the highest level of private job creation in a year. Additionally, pending home sales surged by 7.4% month-over-month, marking the largest jump since June 2020.
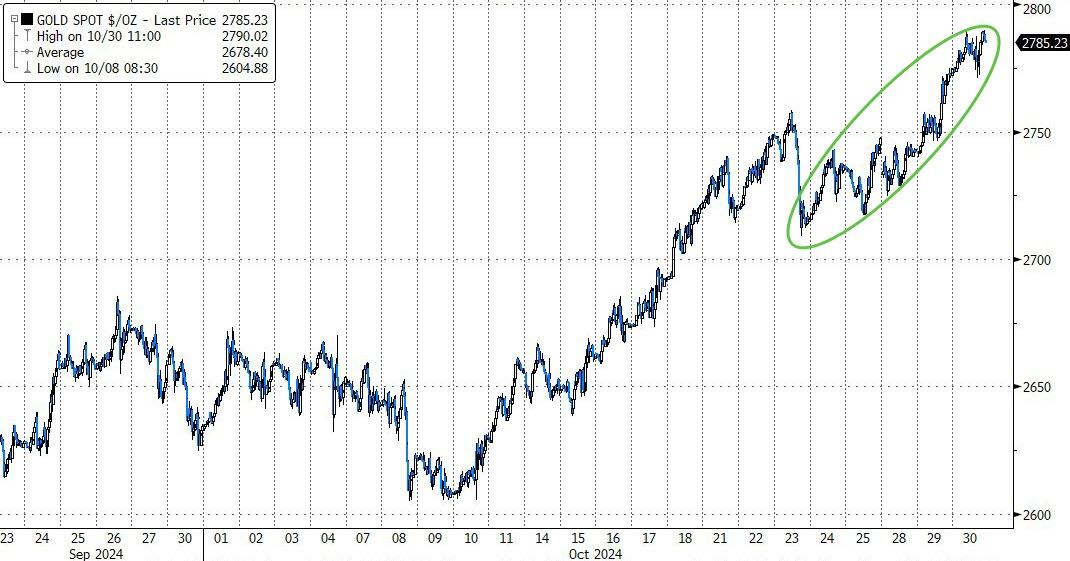
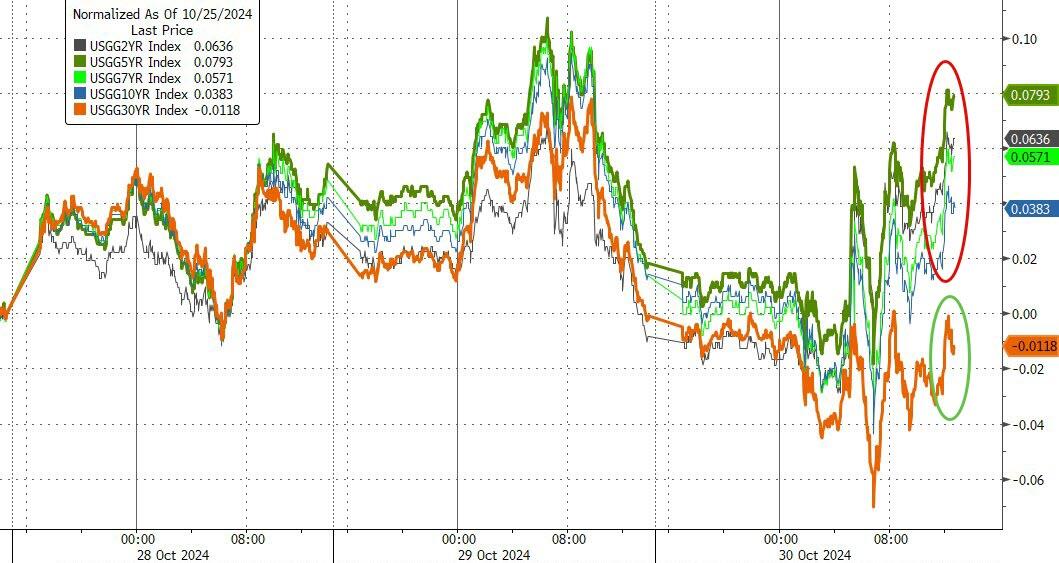
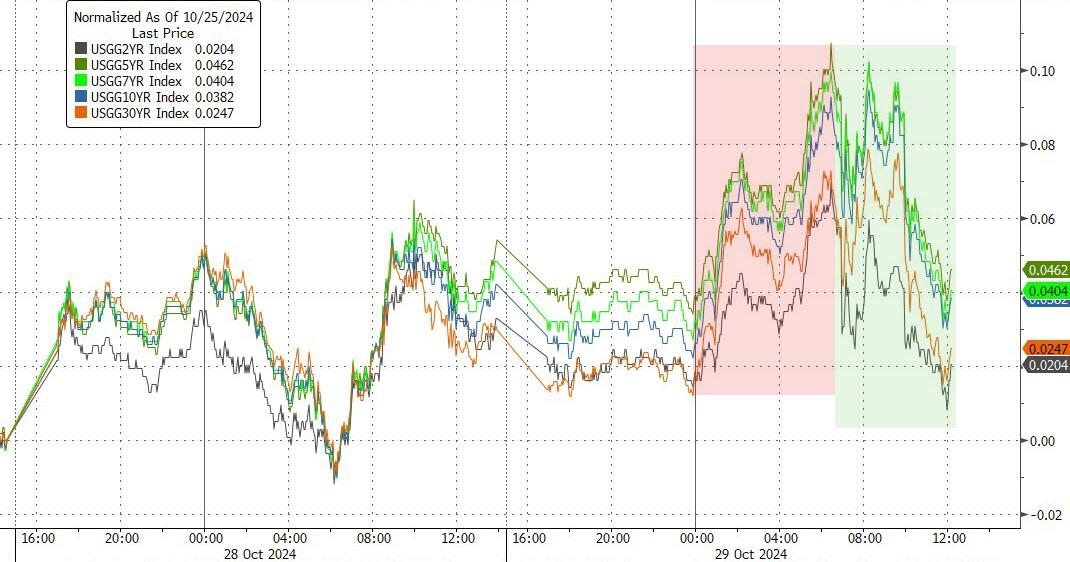
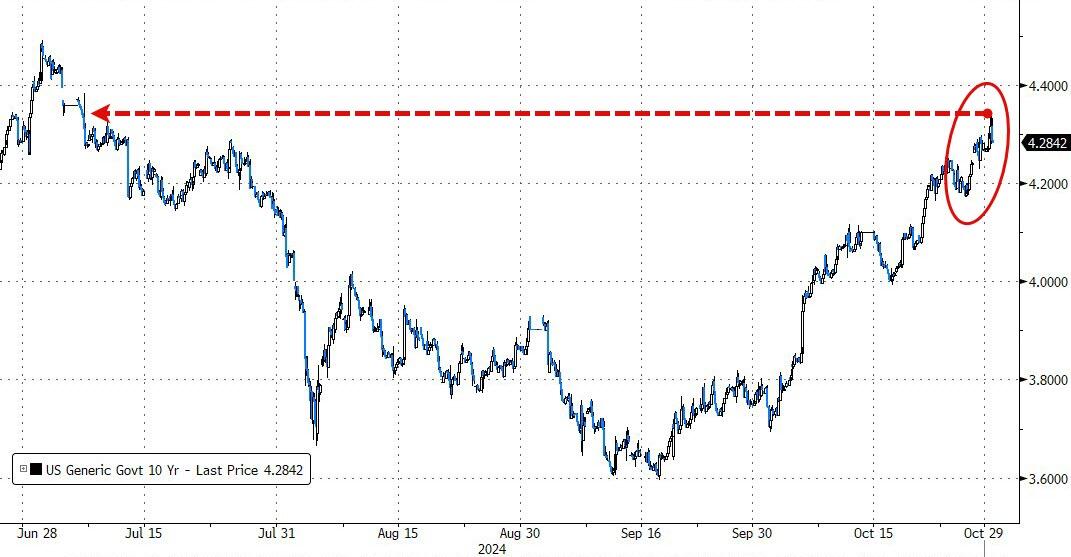
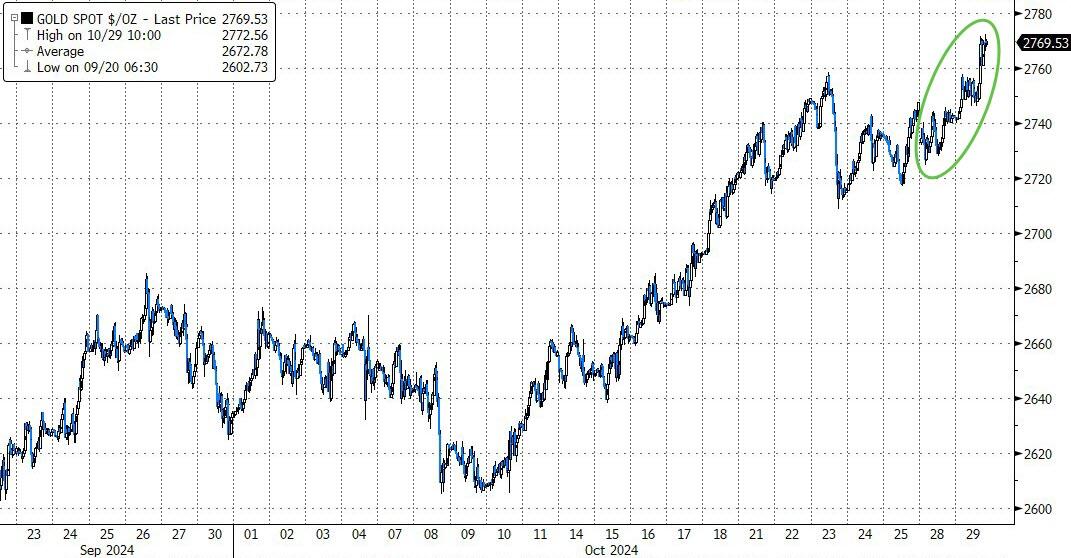
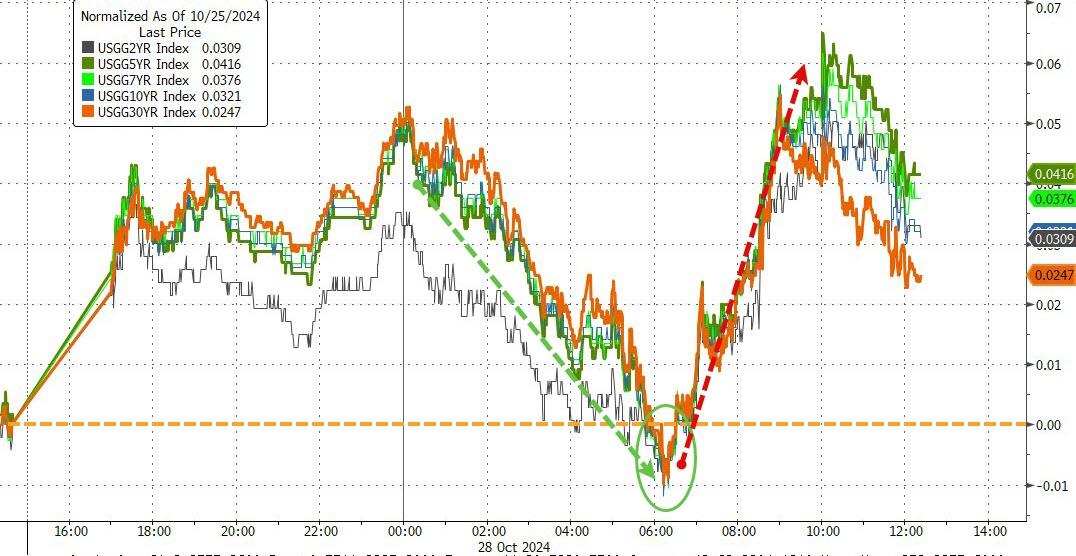
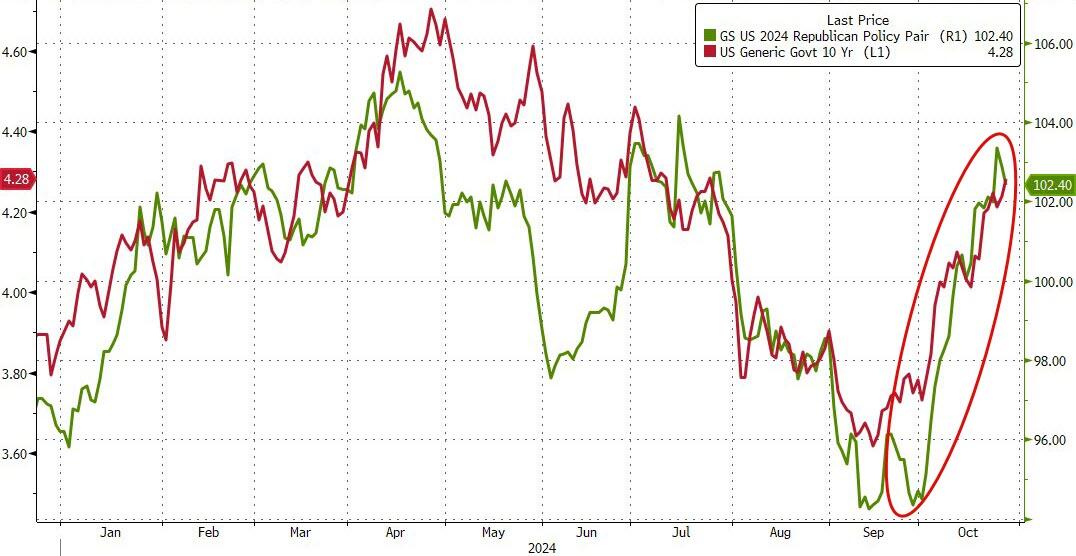
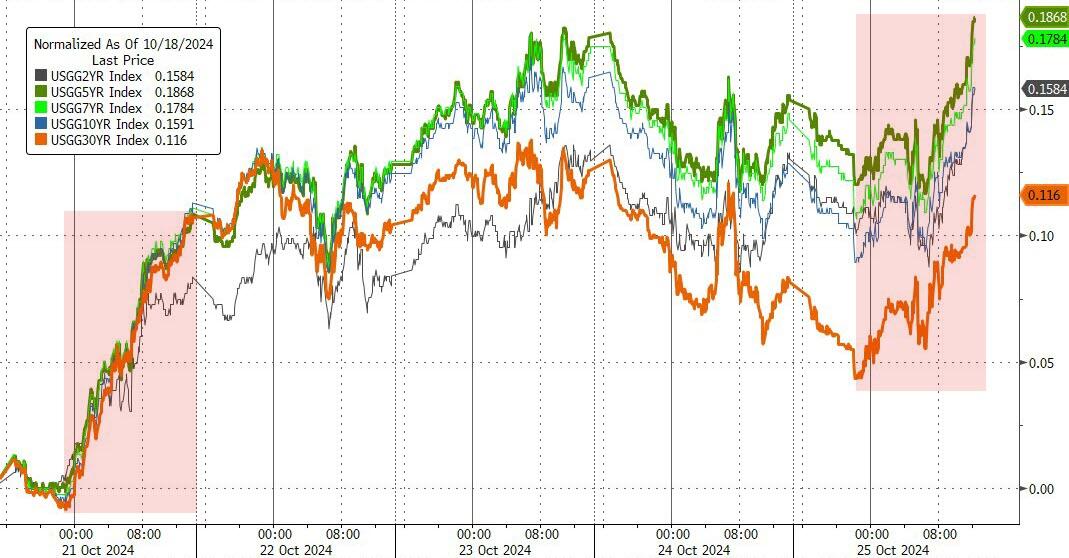
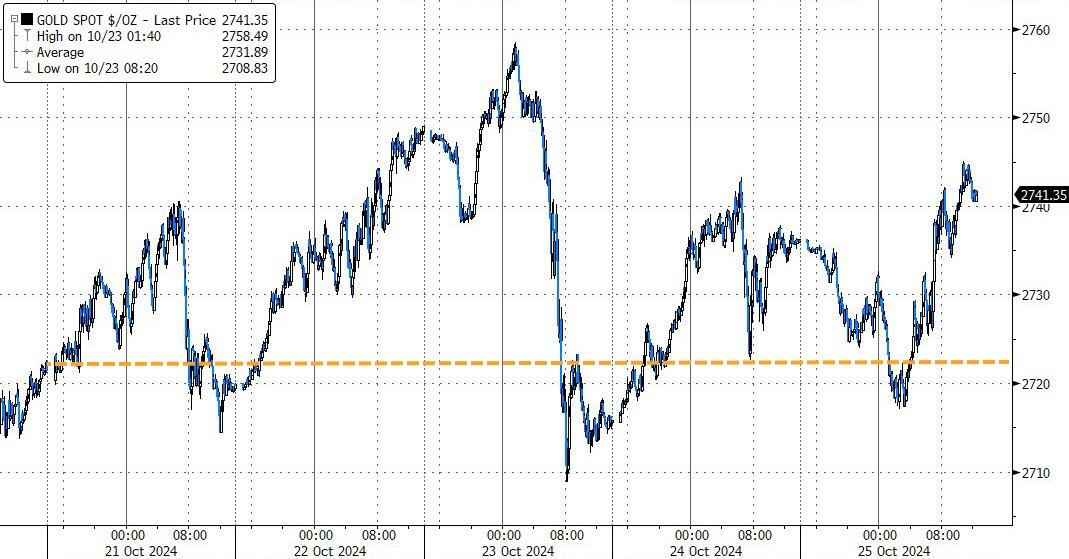
Despite the mixed market environment, gold remained resilient, briefly touching the $2,800 level before retreating. Bond yields experienced another turbulent session, with some traders viewing the Fed’s 0.5% rate cut as a potential policy misstep.
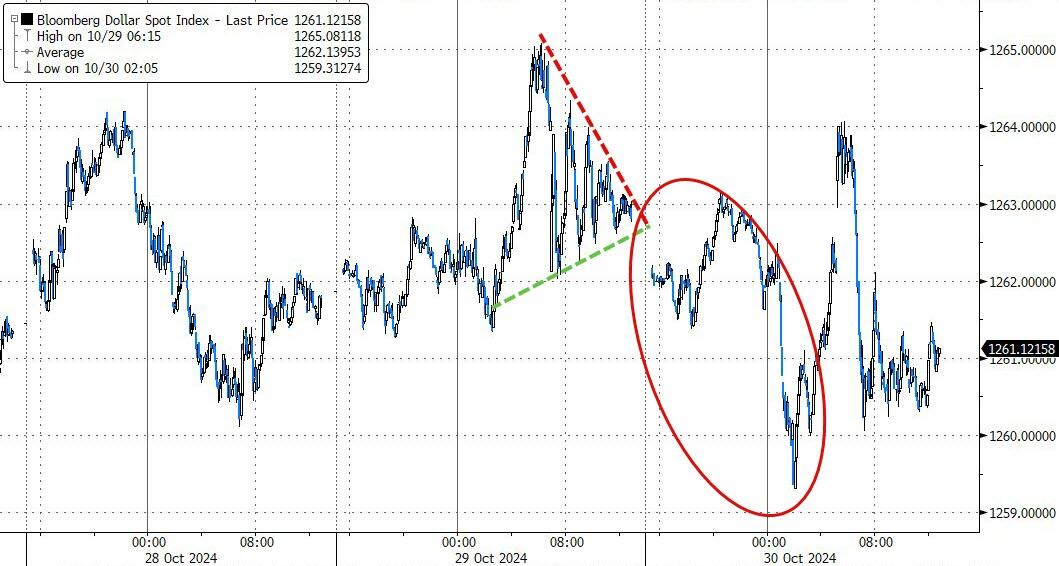
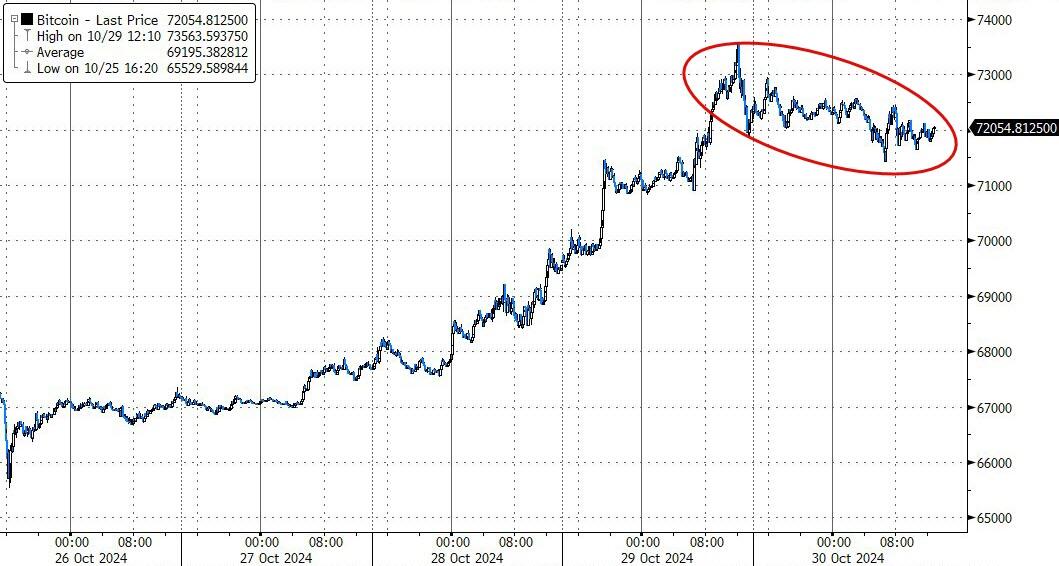
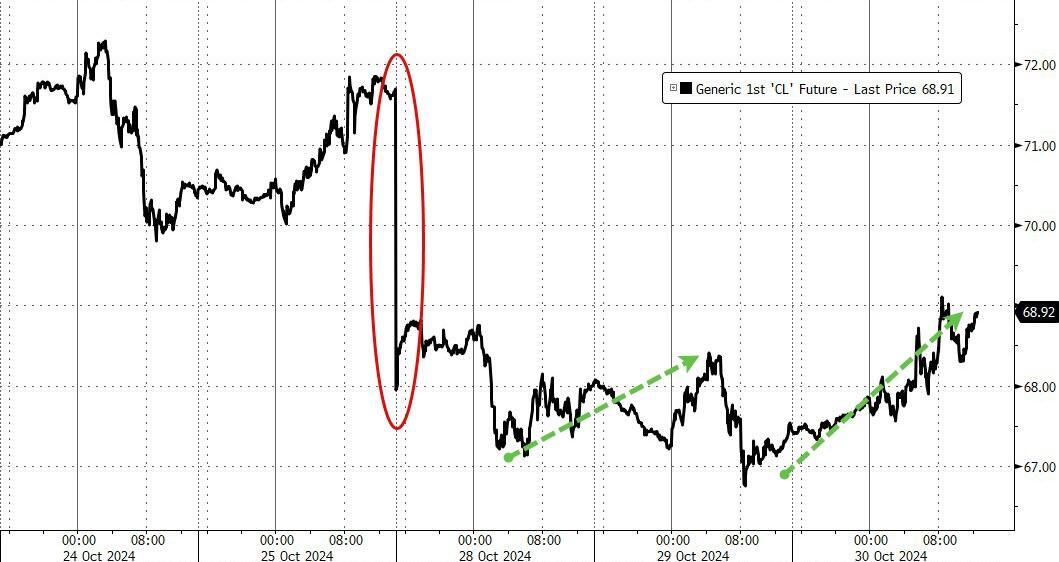
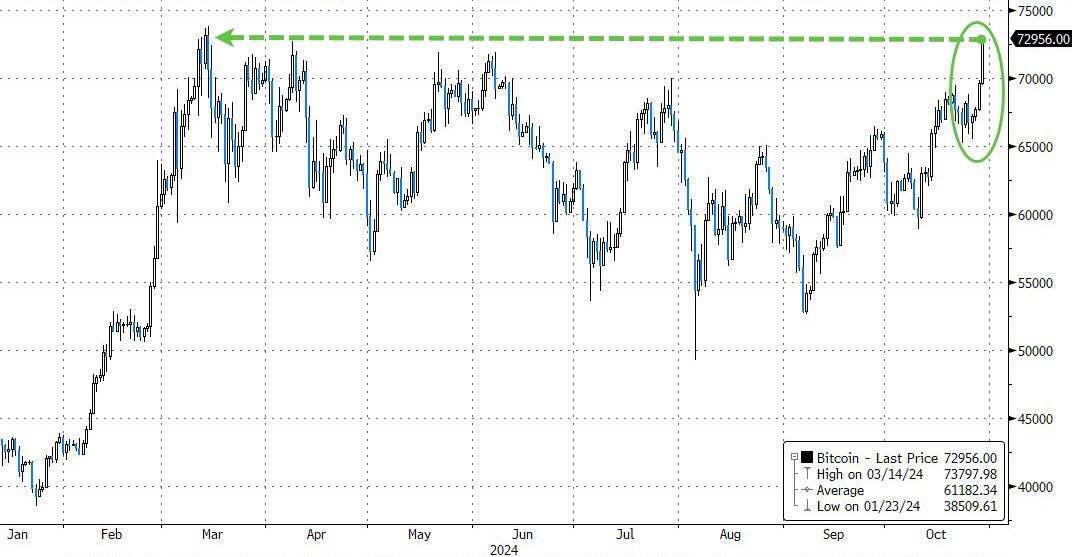
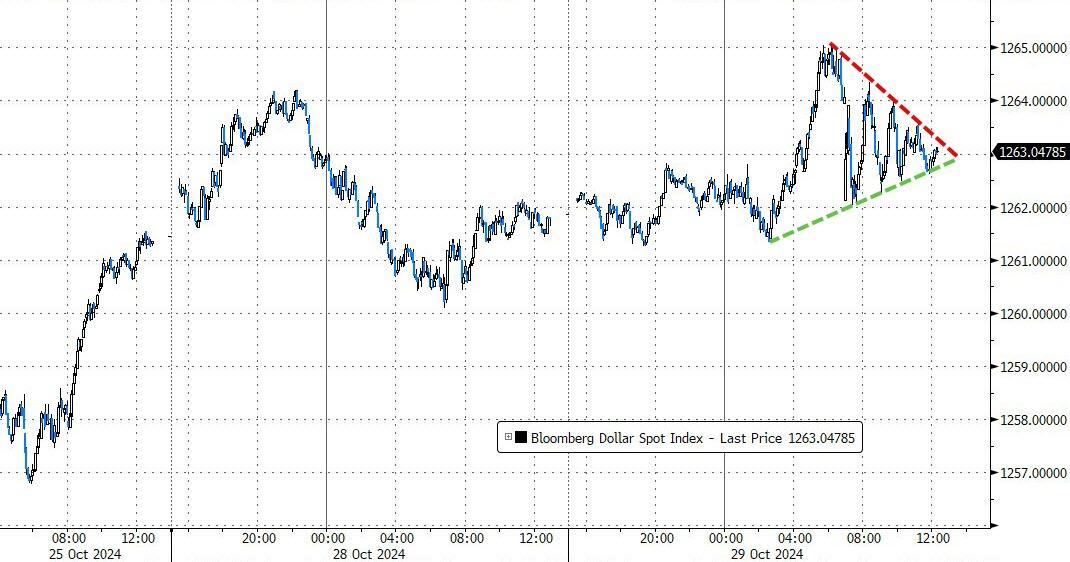
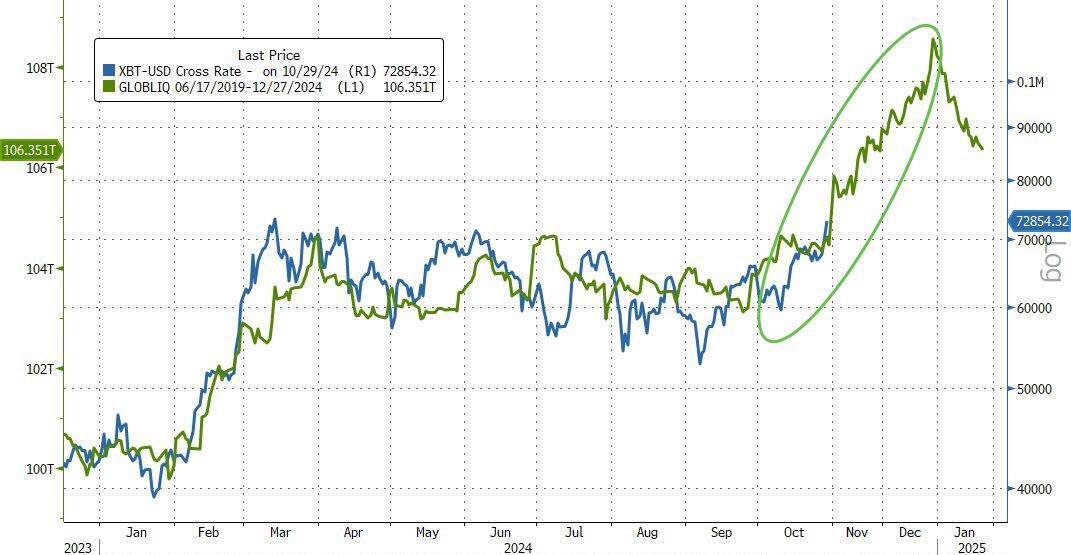
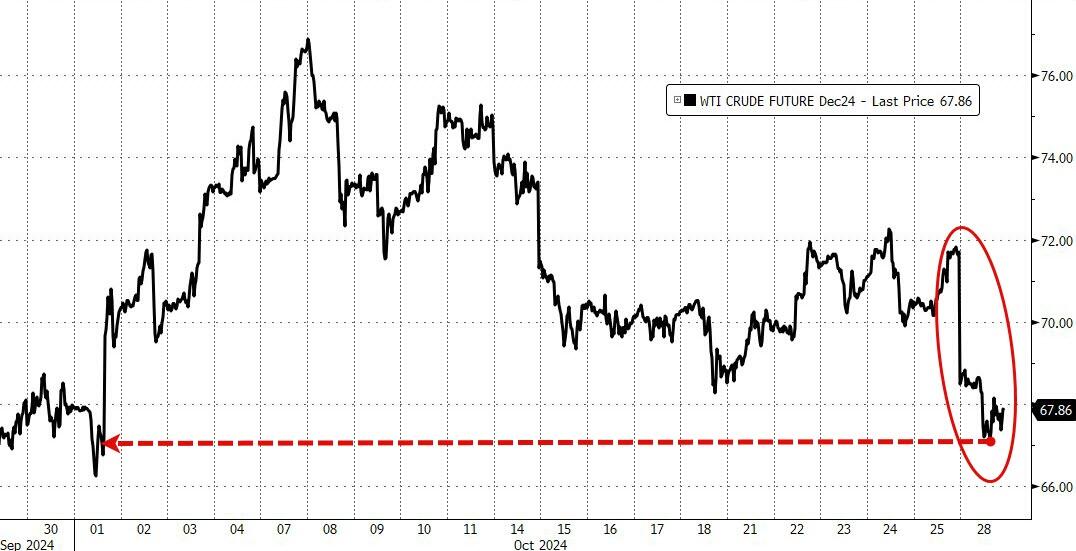
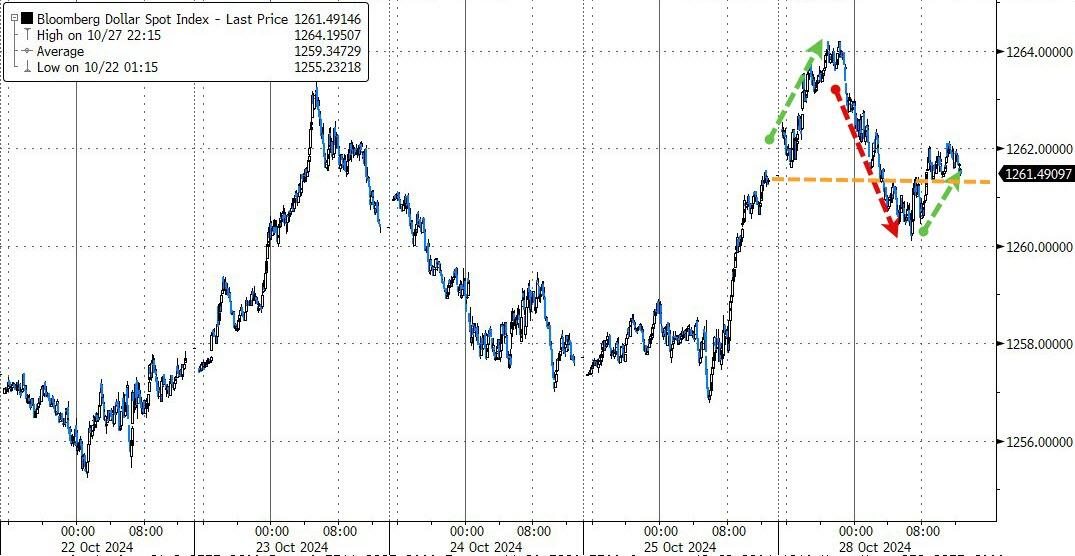
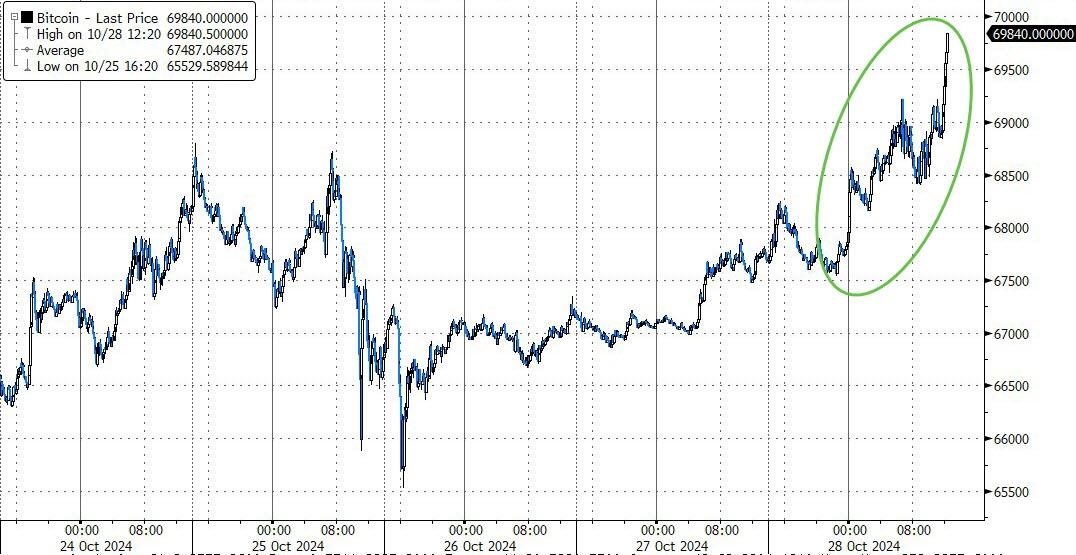
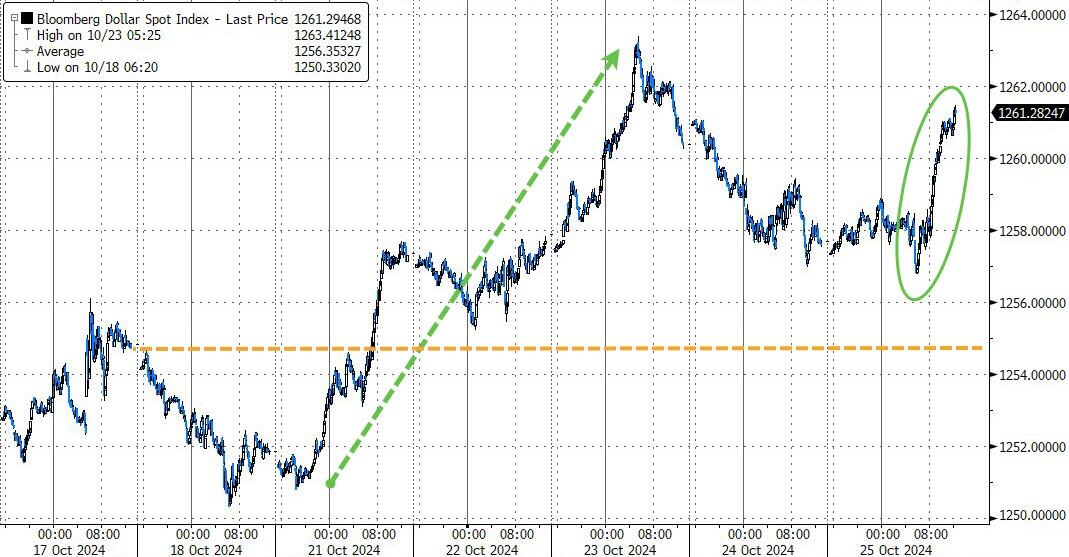
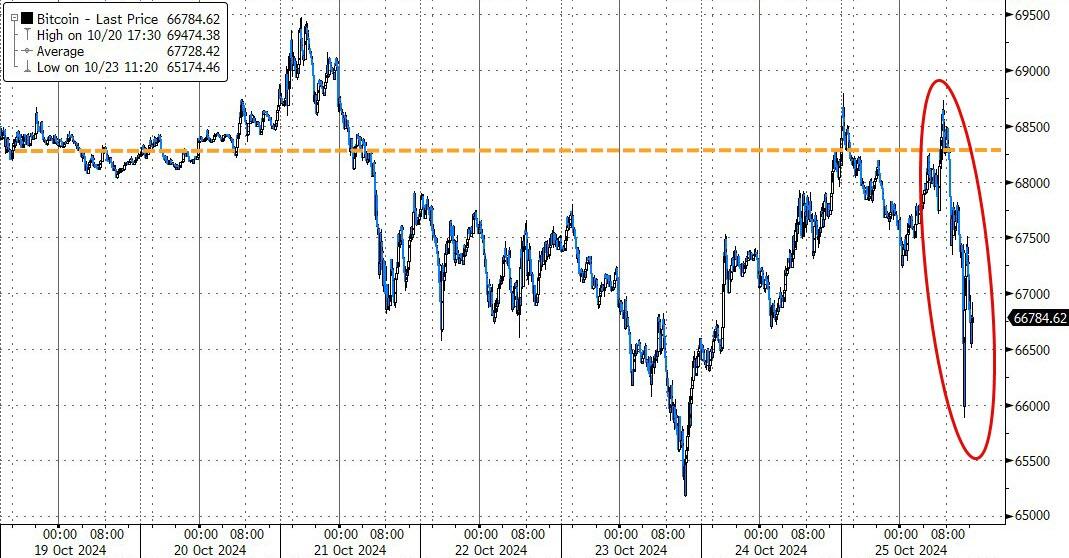
The dollar had a volatile day, ultimately closing lower, while Bitcoin, despite coming off its highs, found solid support around $72,000. Oil prices rebounded but continued to drift below recent highs.
It was a volatile session, and I expect to see more of that as we approach election time.
Read More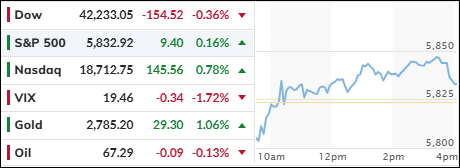
