
- Moving the market
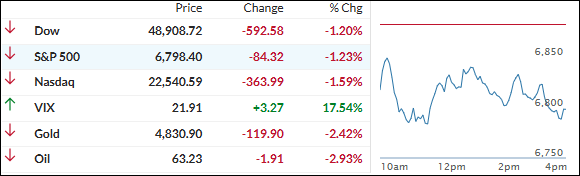
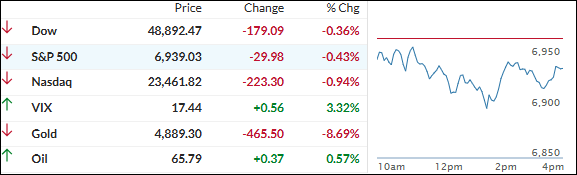
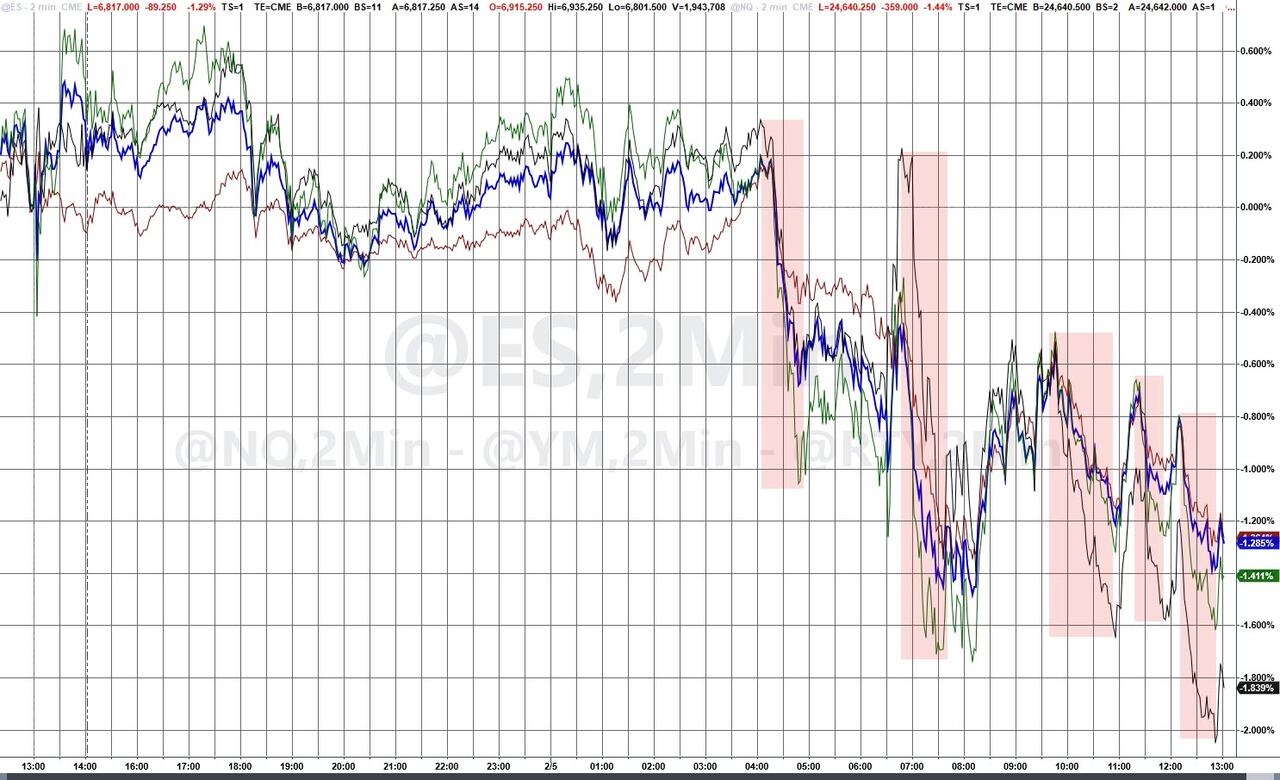
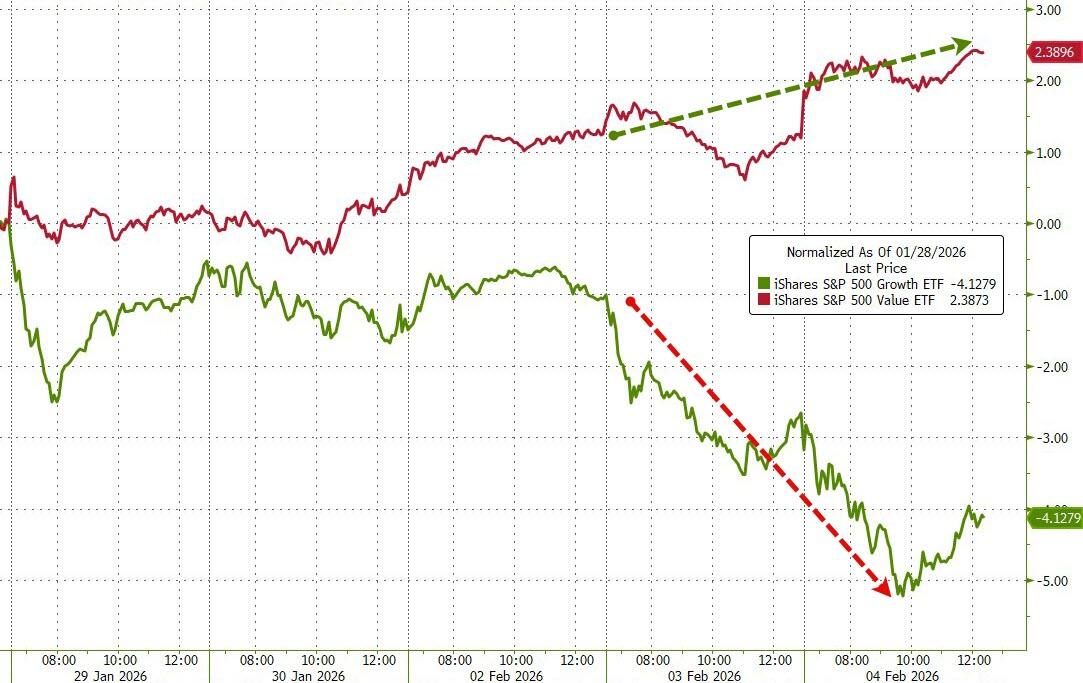
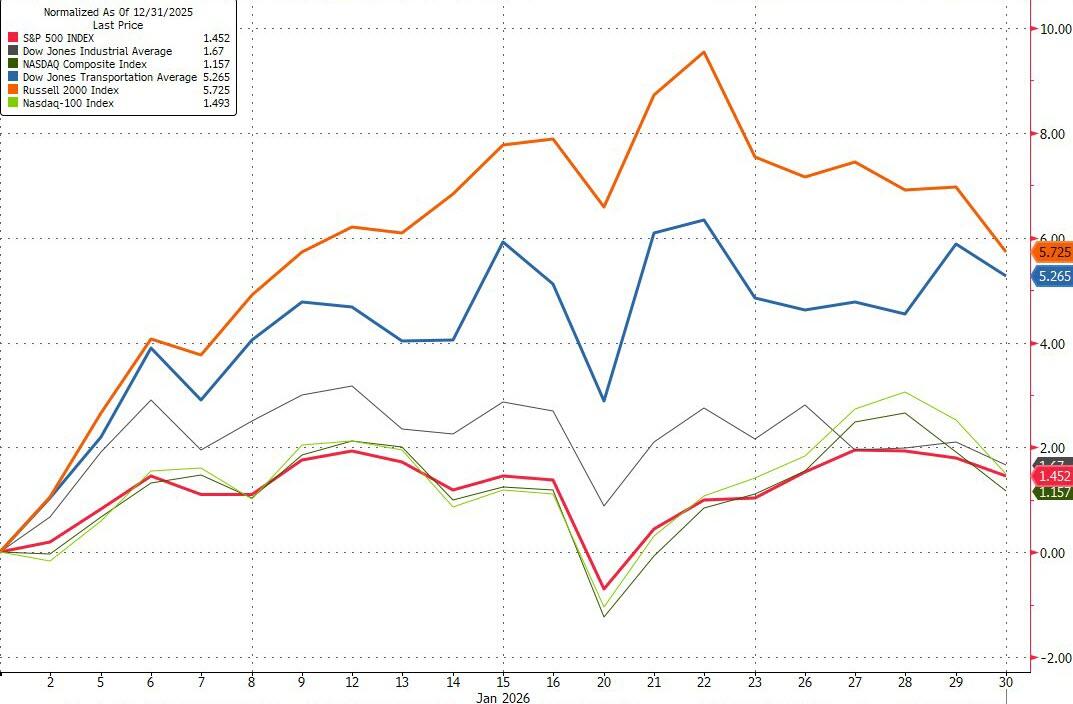
Markets opened weak and never really recovered—the bears were in full control, driving a sharp, one-sided selloff across almost everything.
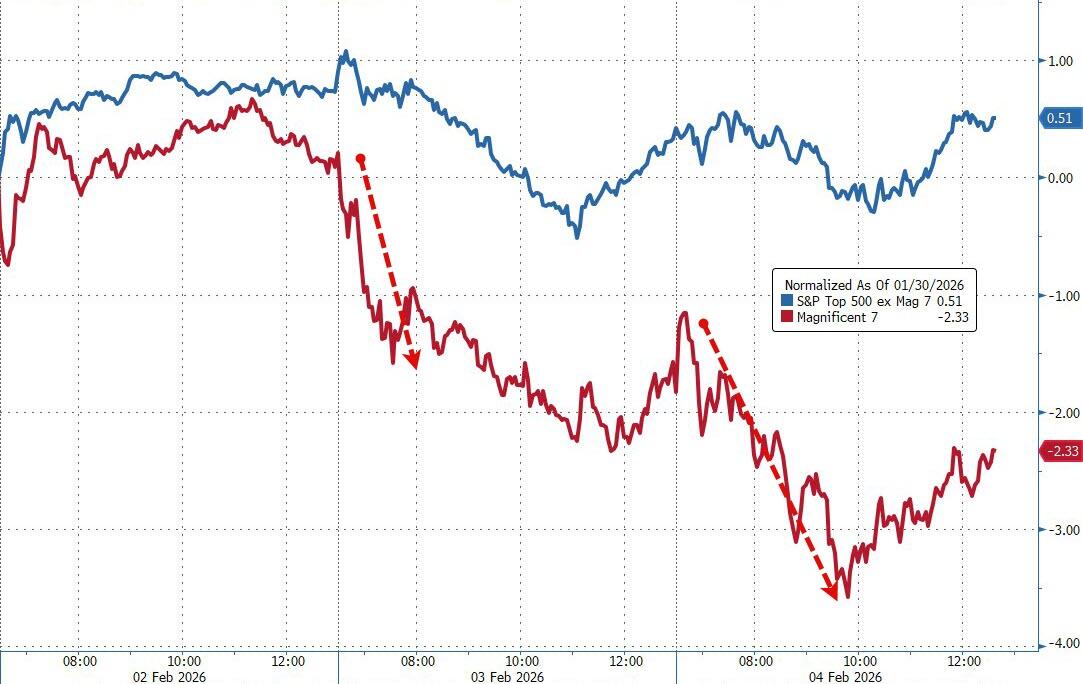
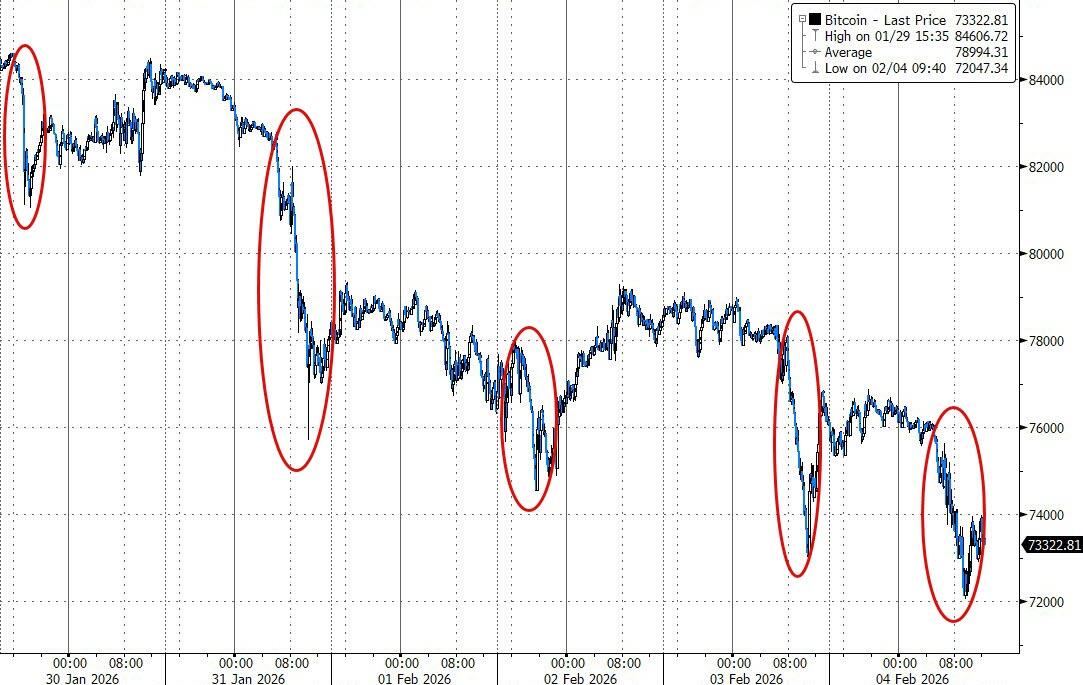
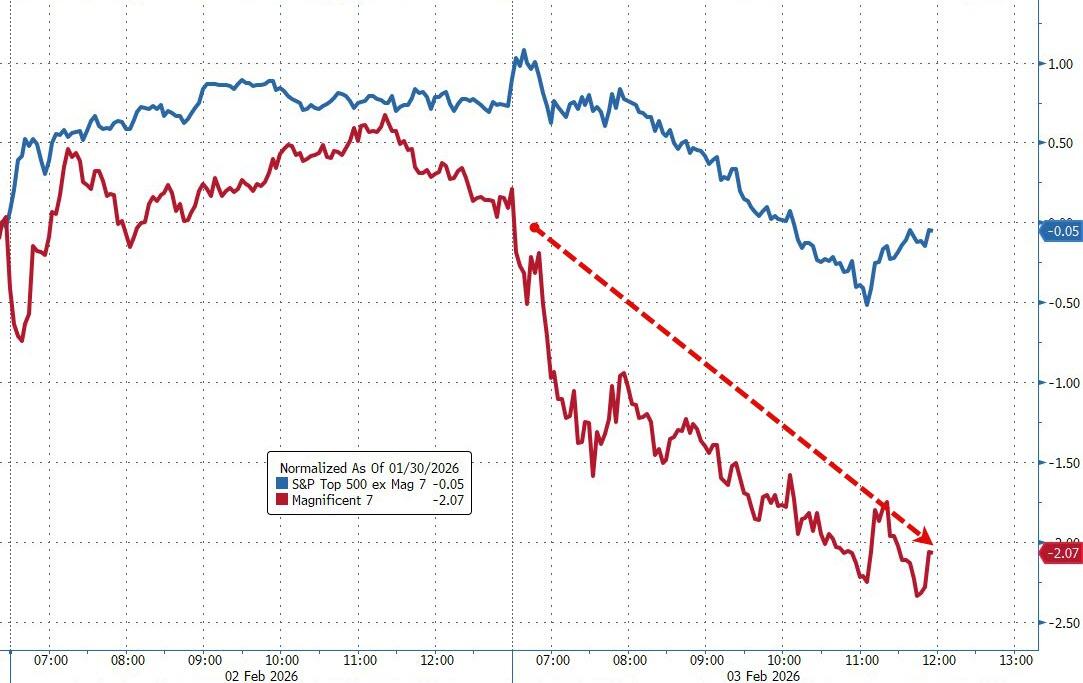
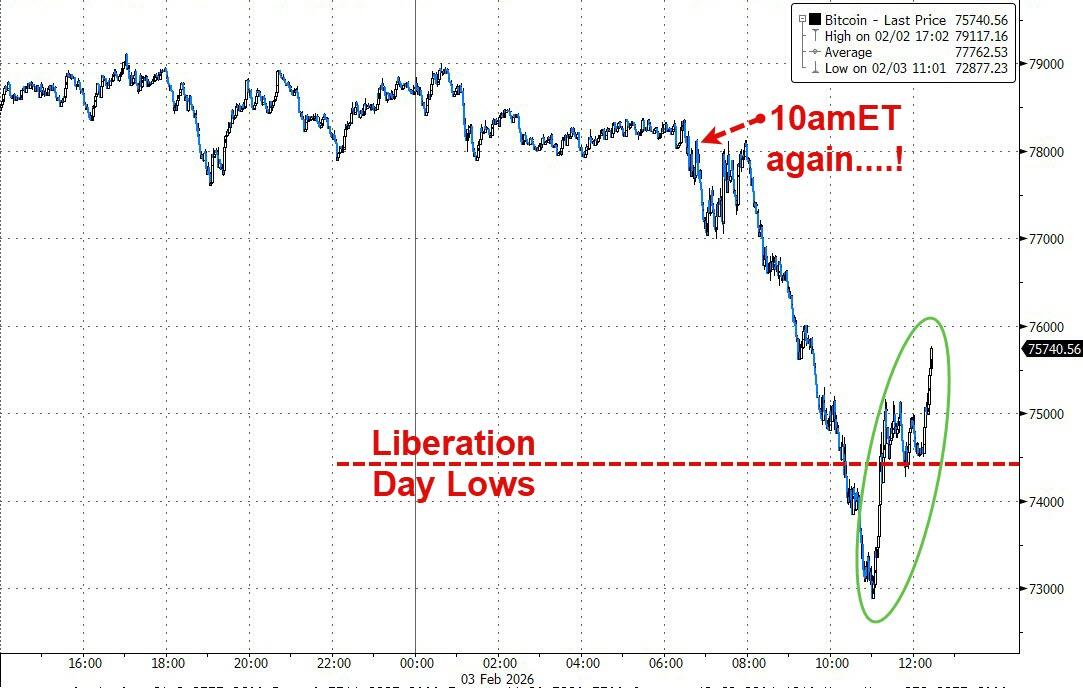
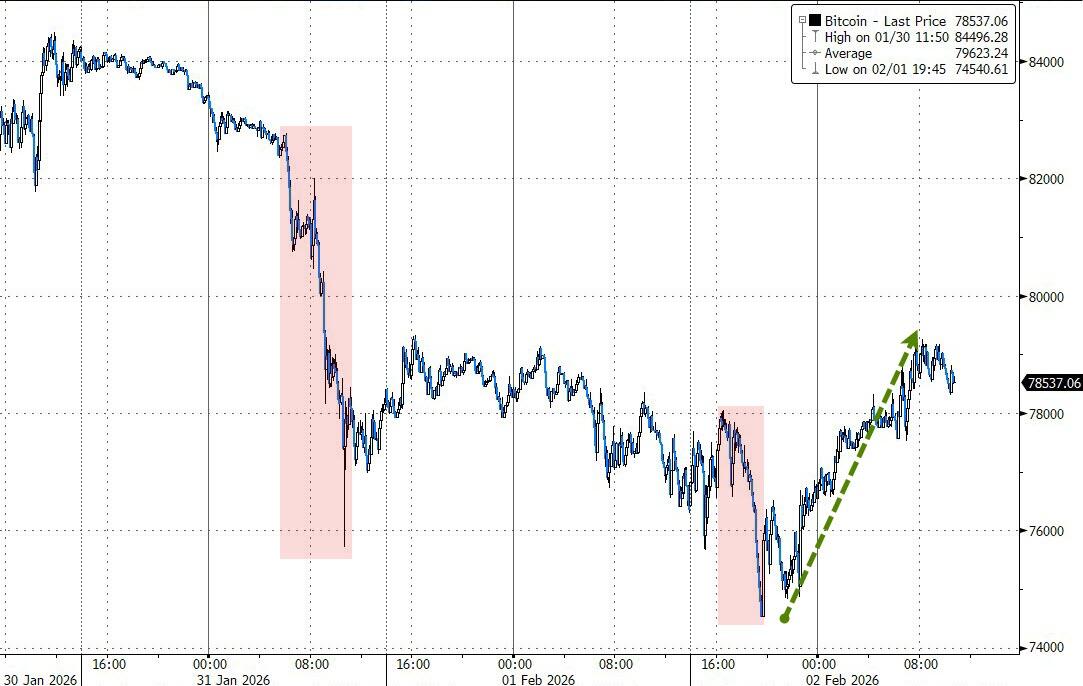
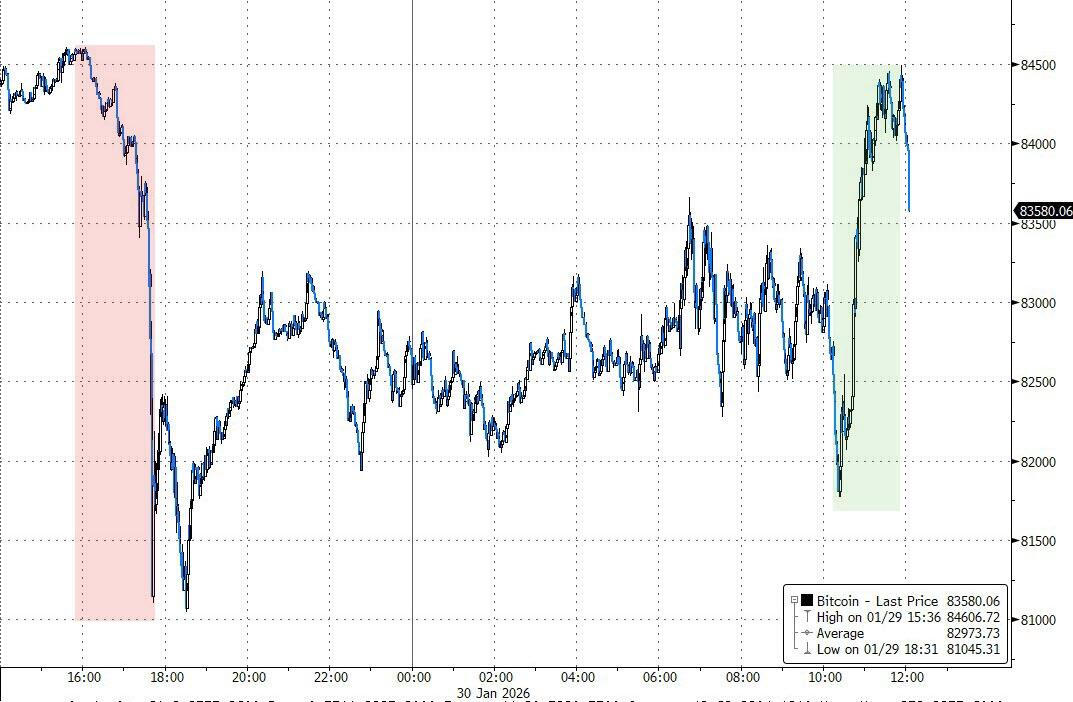
The major indexes dove lower, with tech getting hit especially hard and Bitcoin sinking toward $65,000 (after briefly dipping below $70,000, a level many saw as key support).
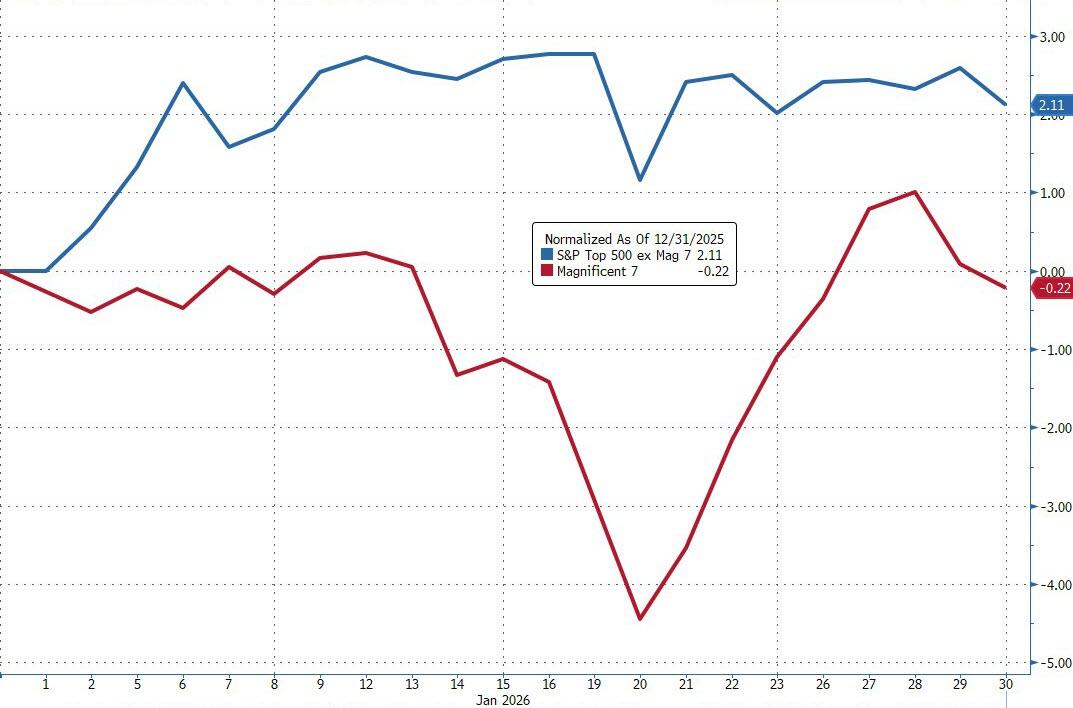
The trigger was Alphabet’s earnings: they projected a big jump in AI spending (up to $185 billion in capex for 2026), which spooked some investors who want to see revenue growth catch up first. Shares fell 5%.
Broadcom bucked the trend and jumped almost 2% on the spending news (hope for chip suppliers), but most of the AI crew felt the pain. Qualcomm slid 7% on a weaker forecast tied to a global memory shortage.
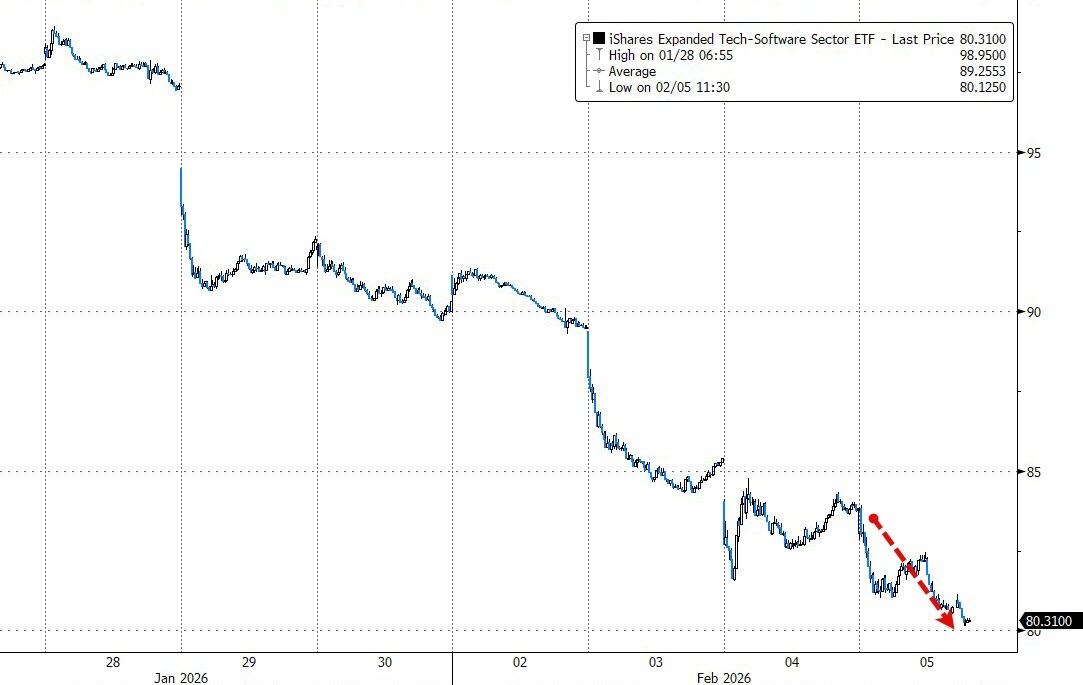
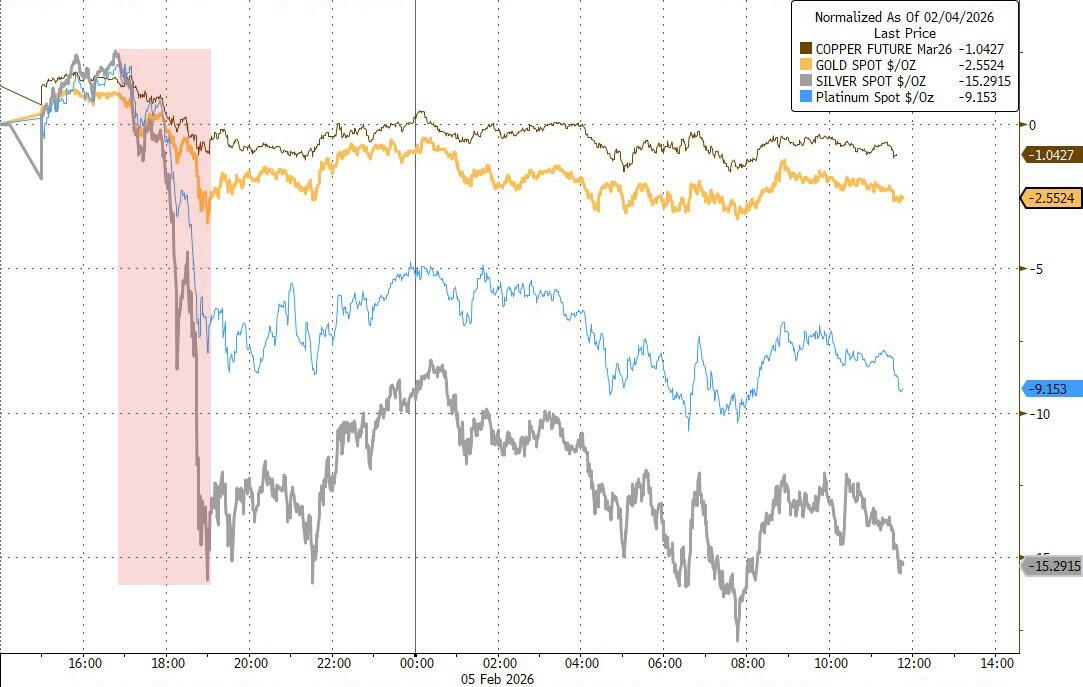
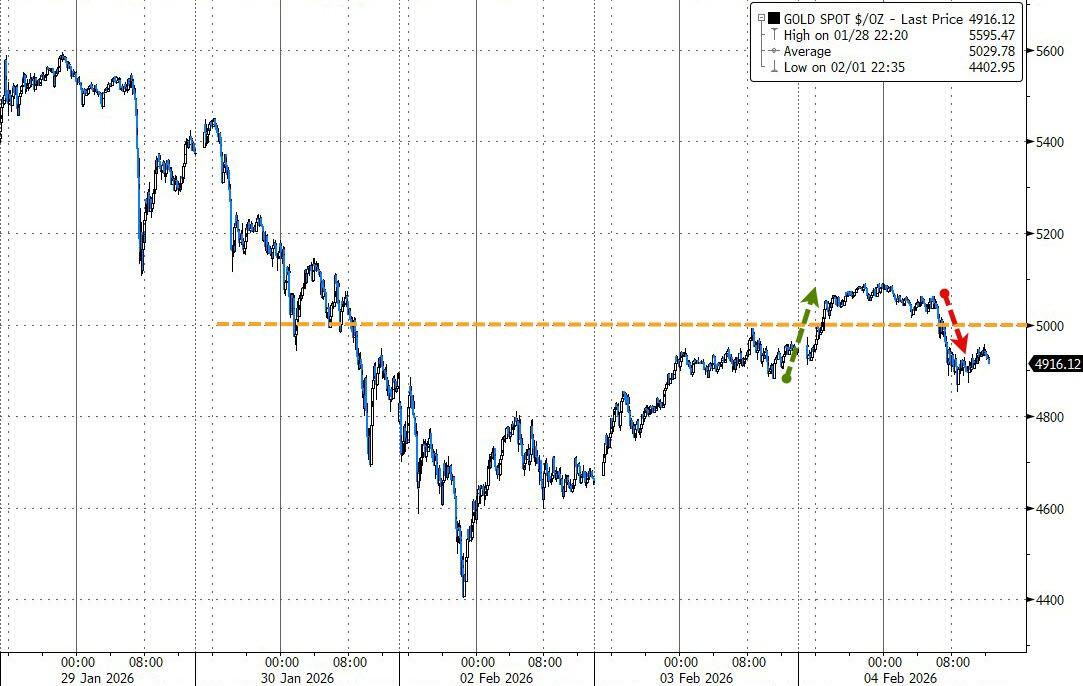
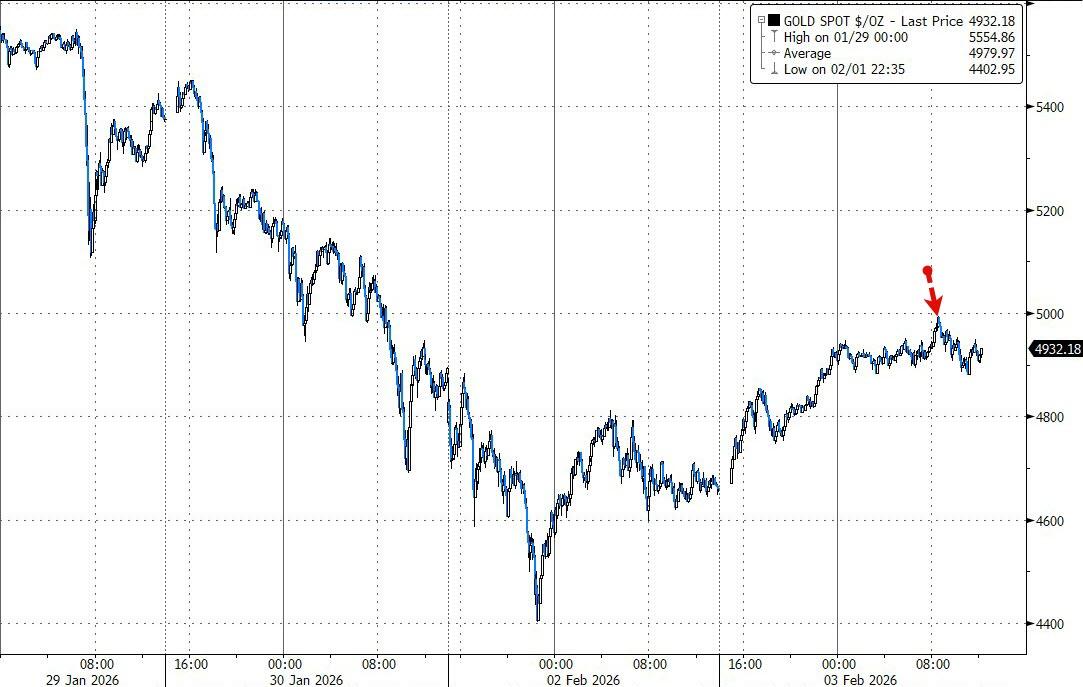
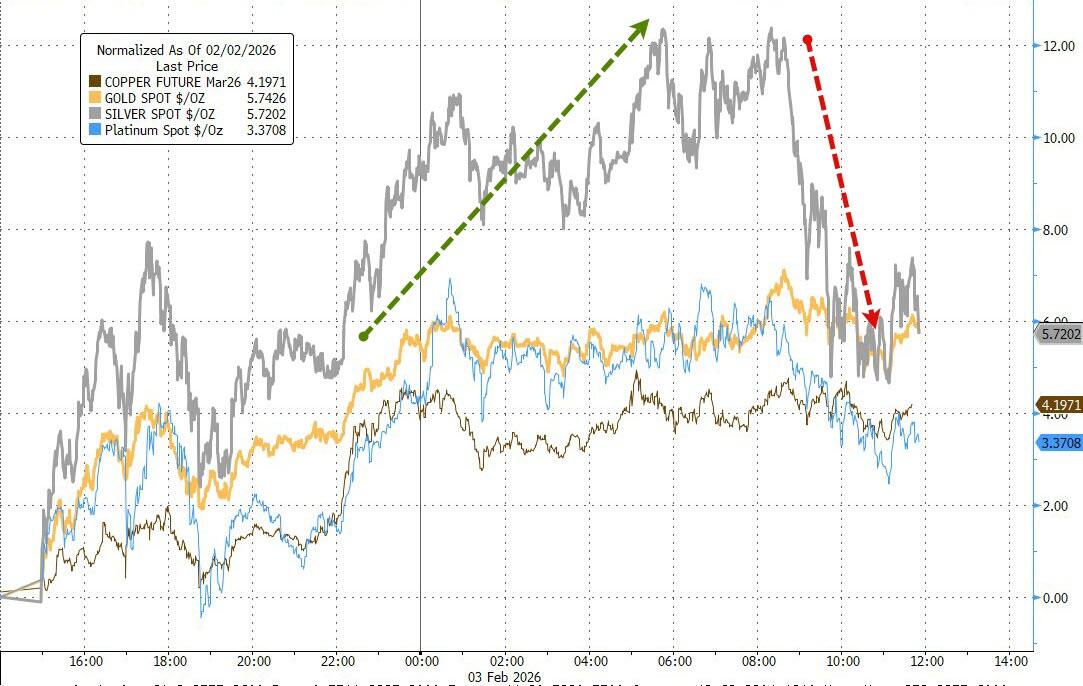
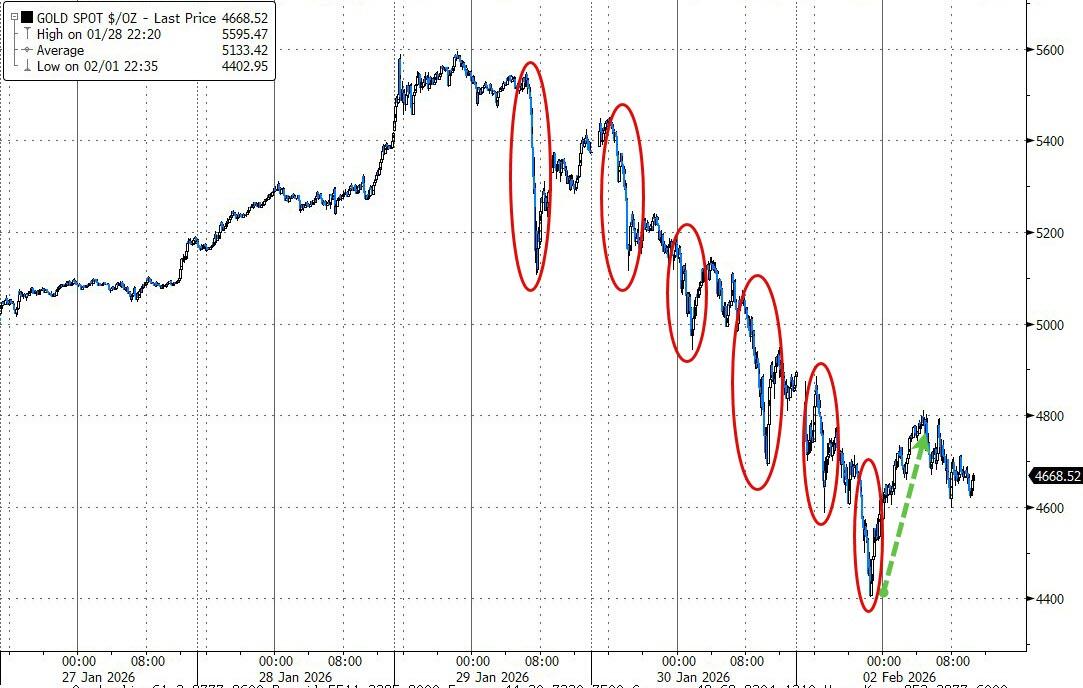
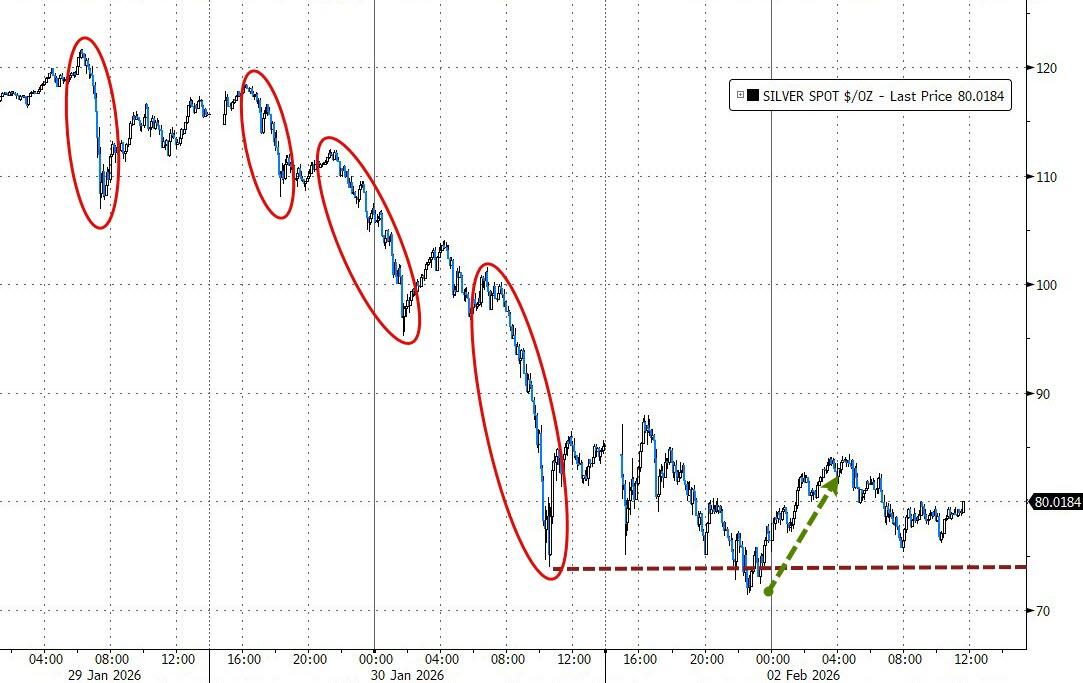
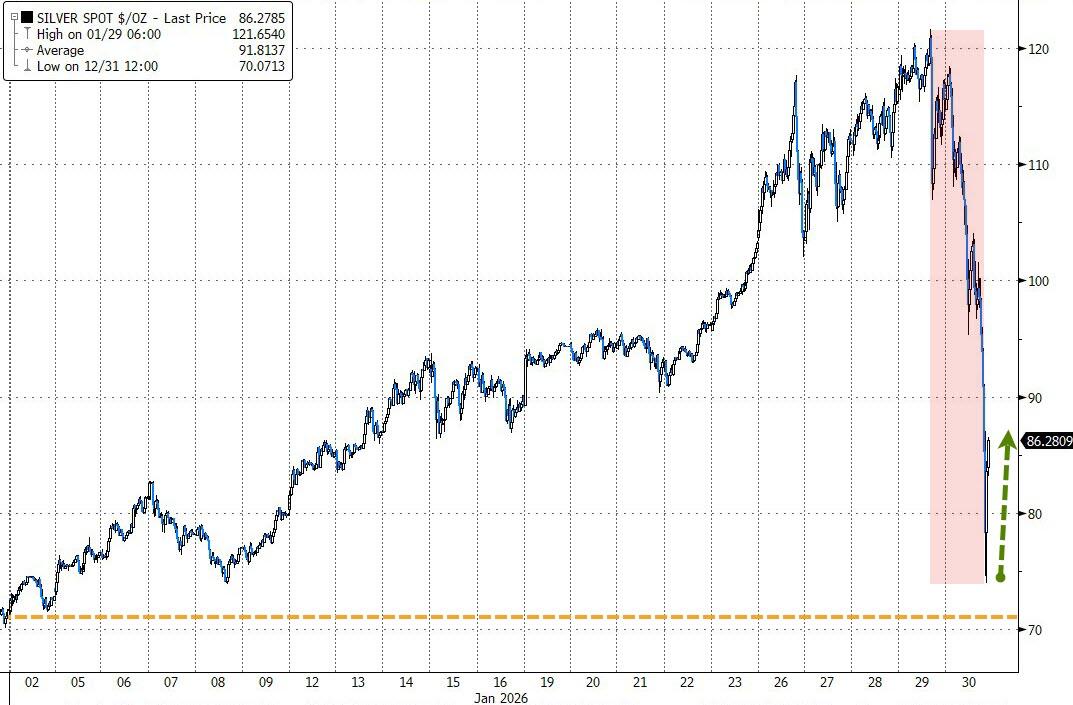
The selloff spilled into software (now in its 8th straight down day) and precious metals.
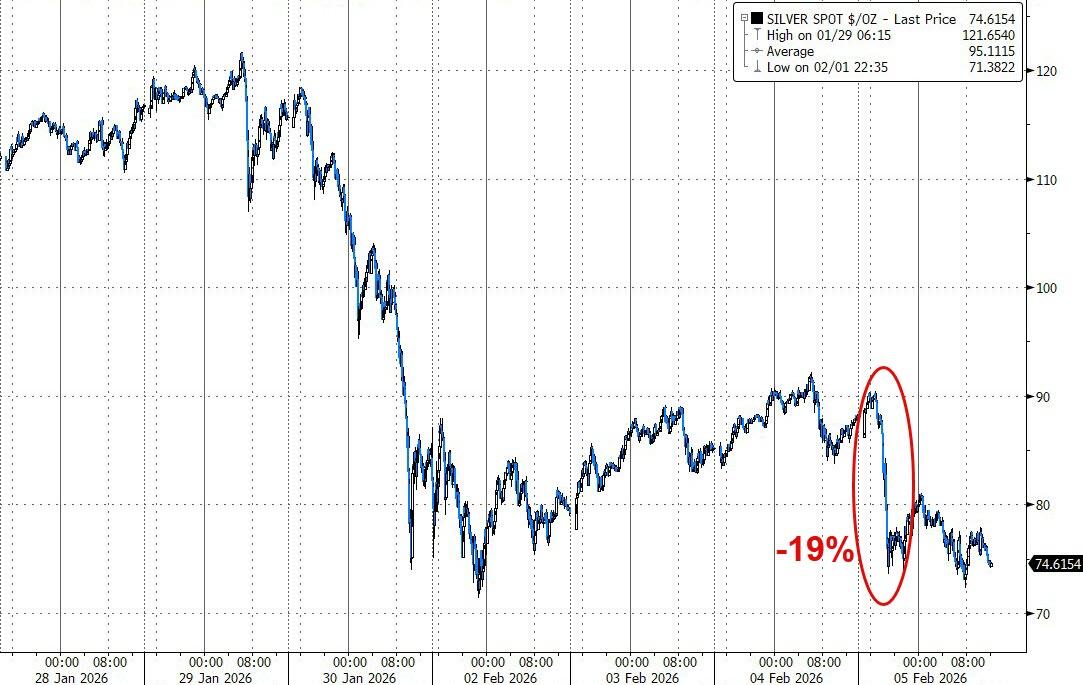
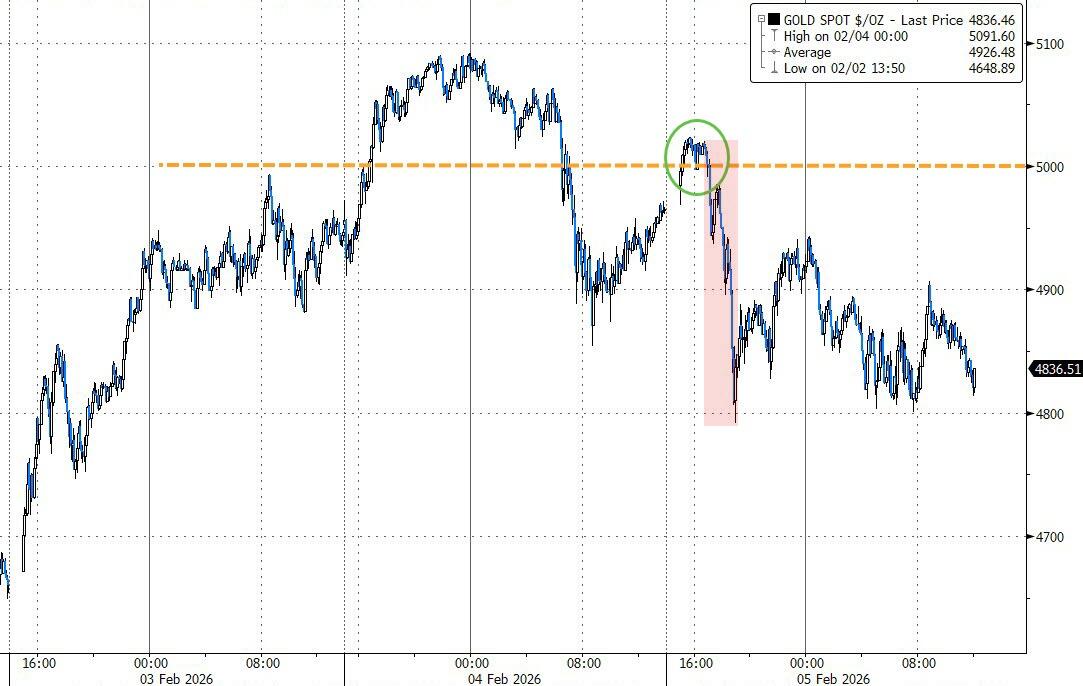
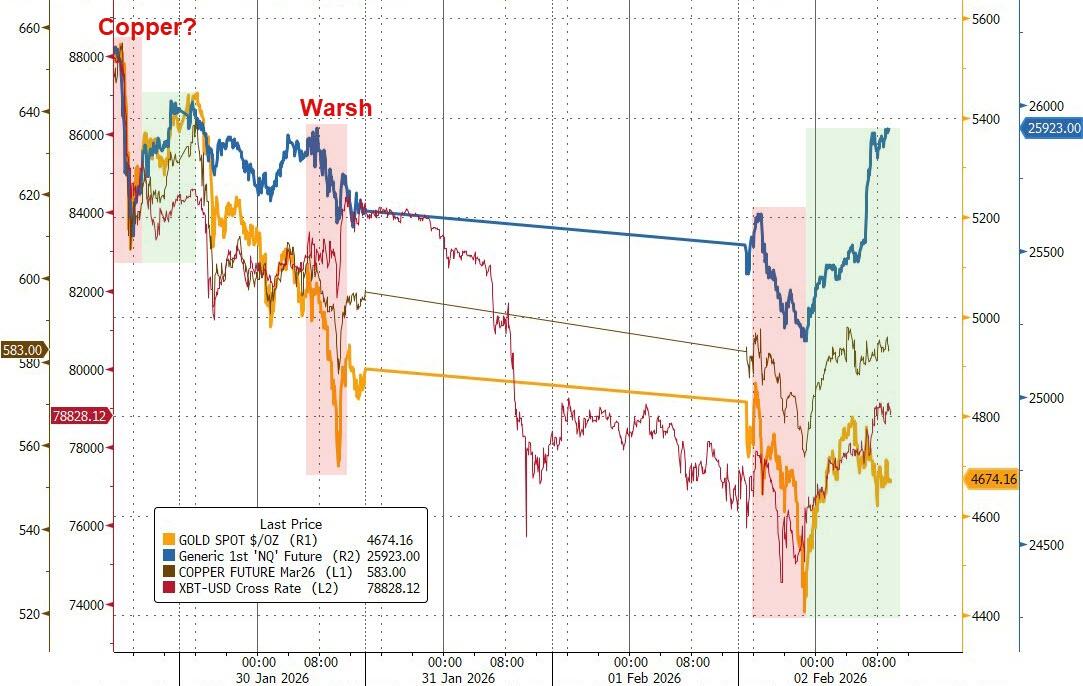
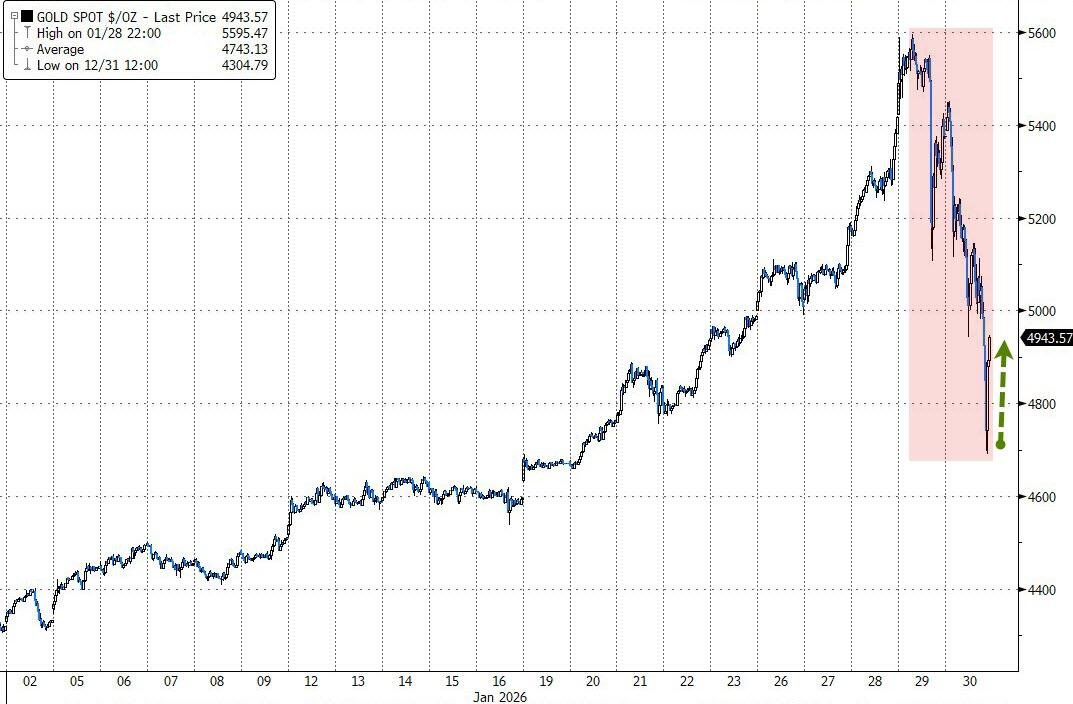
Silver crashed as much as 19% overnight (after liquidation in Shanghai flowed into U.S. markets), while gold briefly touched $5,000 before losing it.
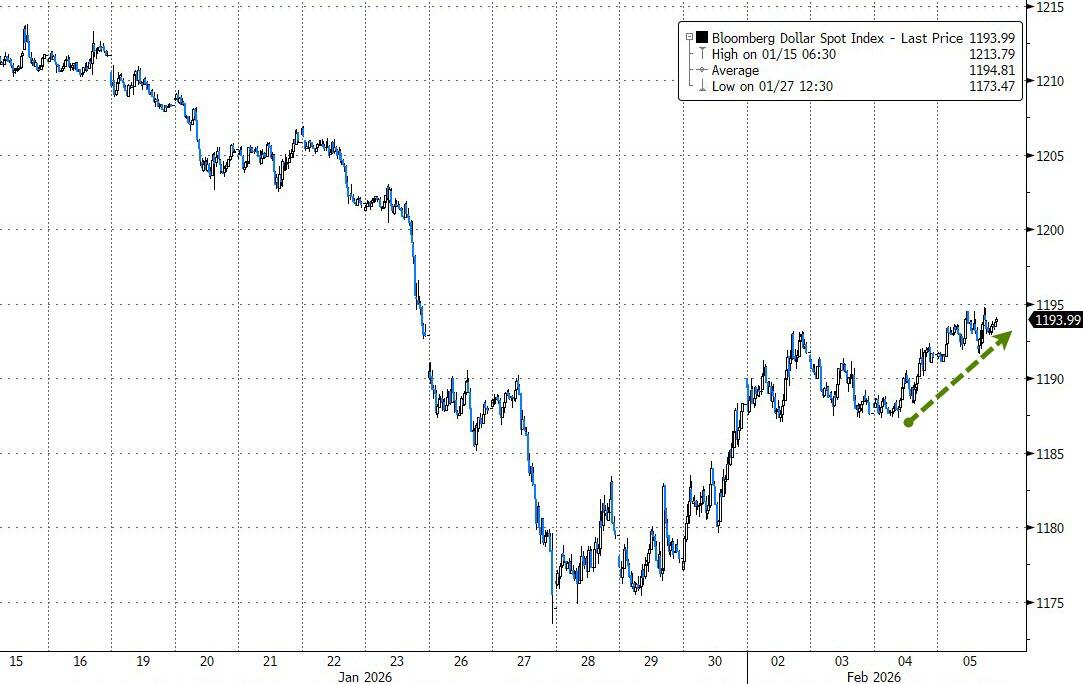
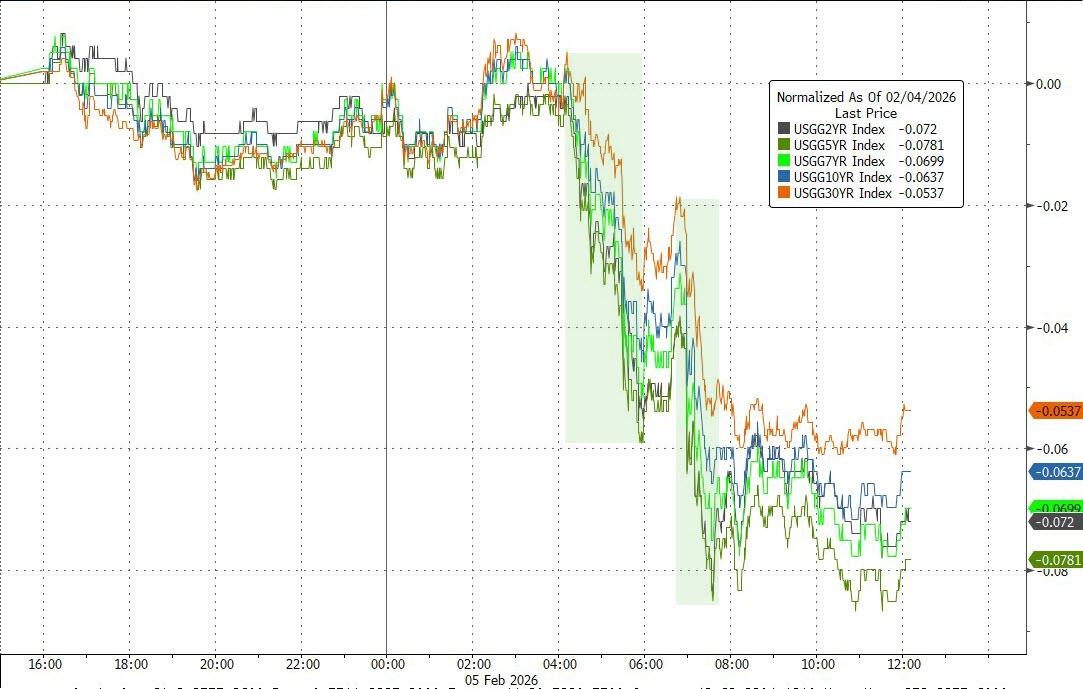
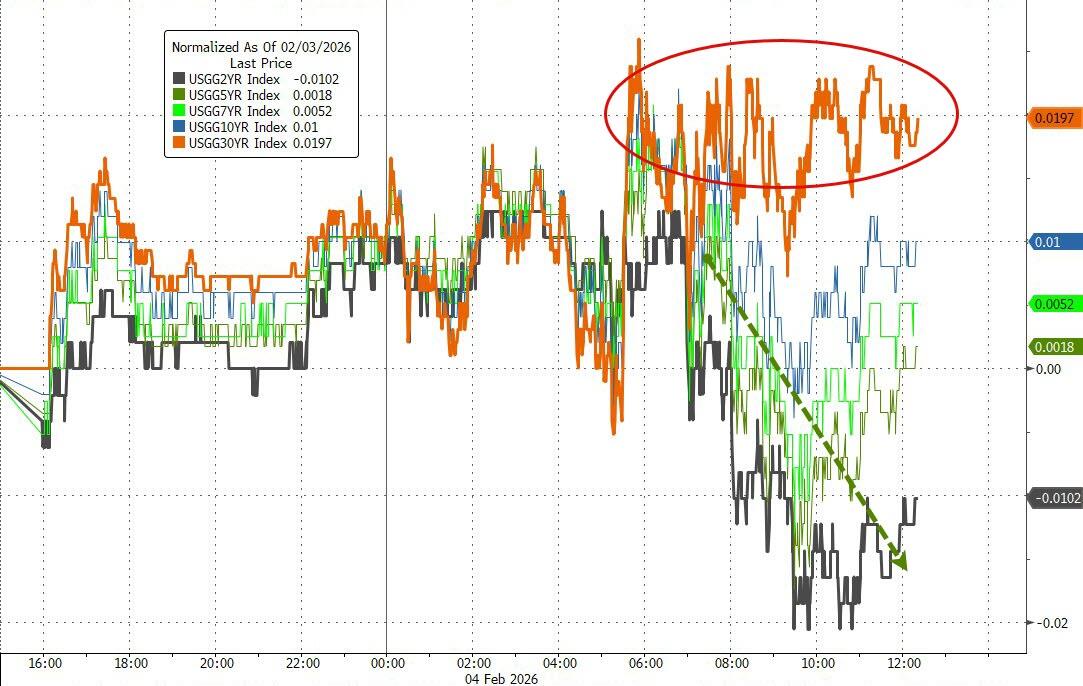
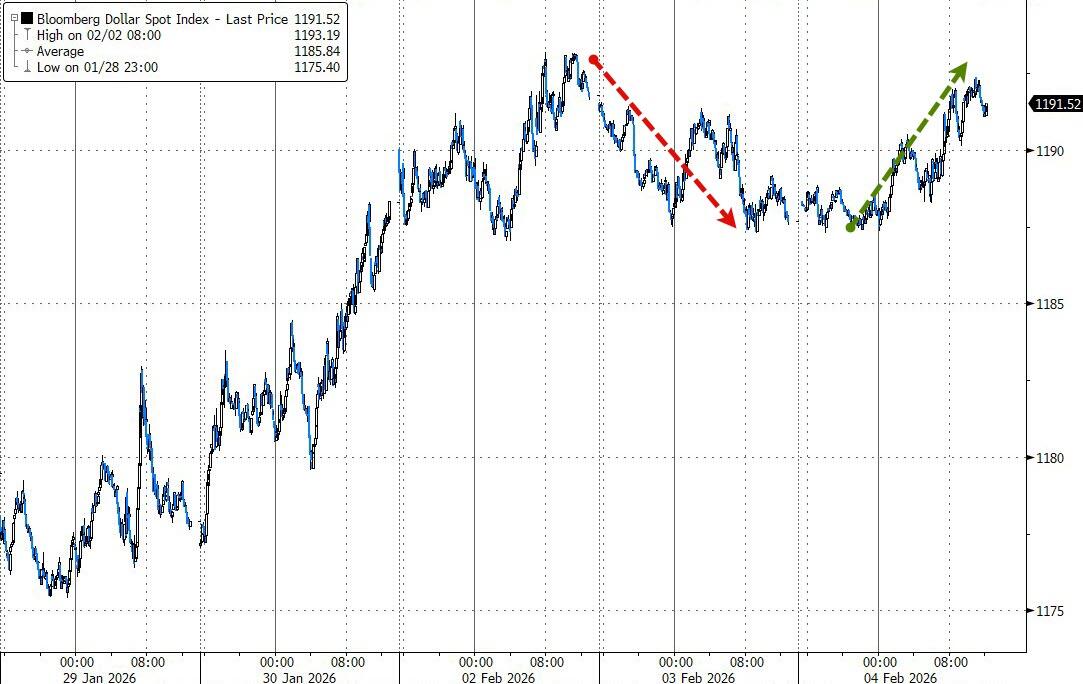
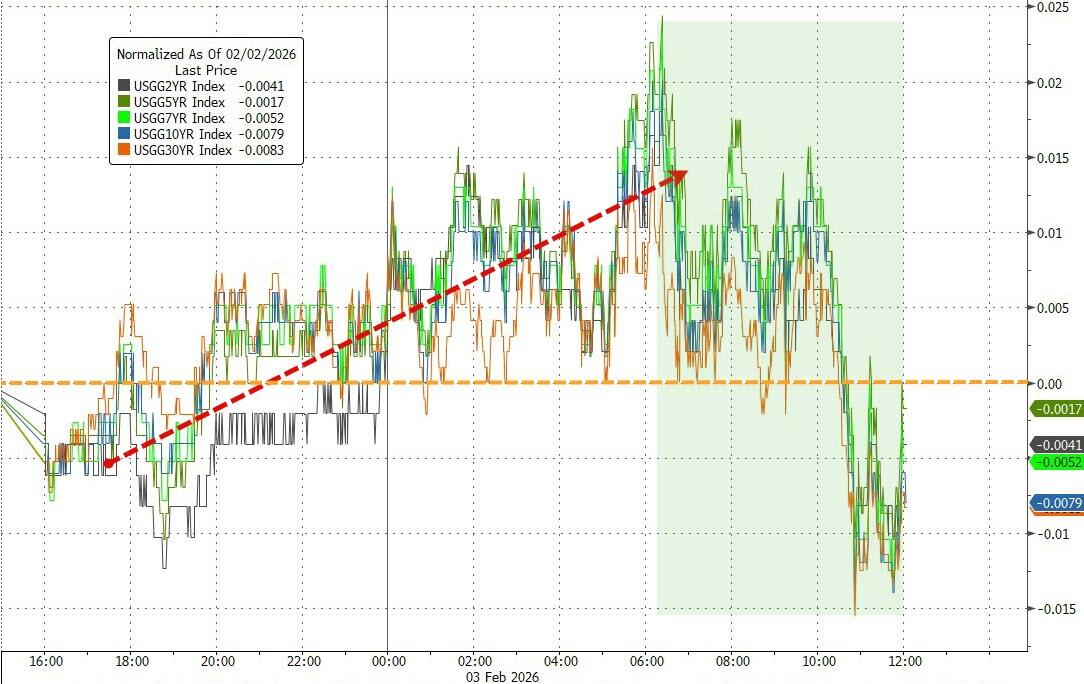
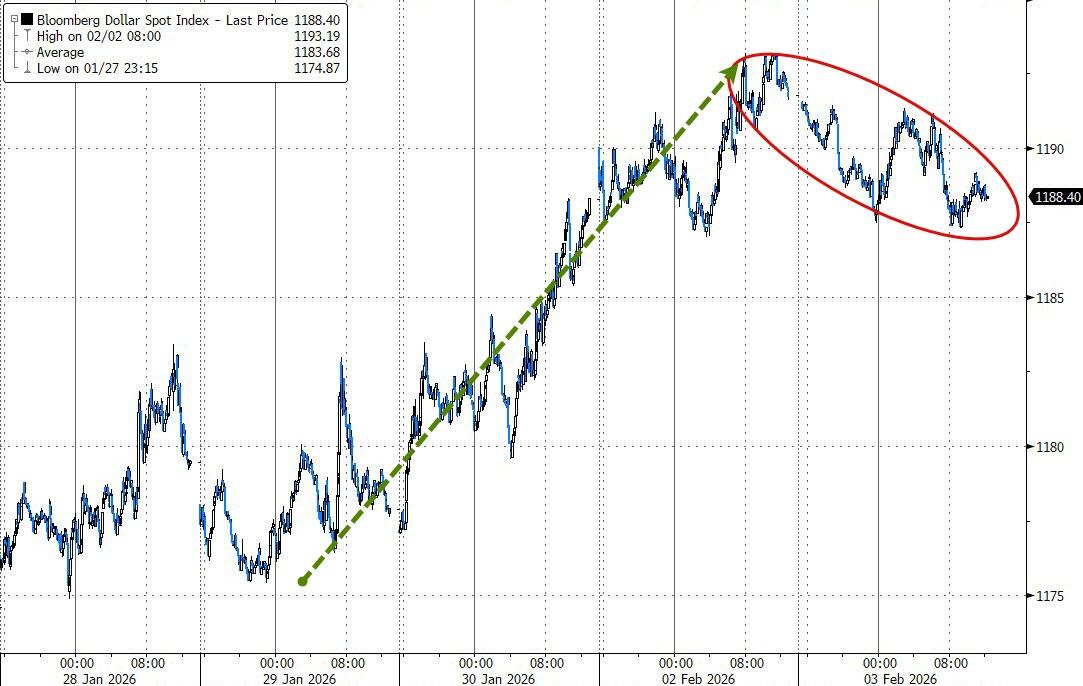
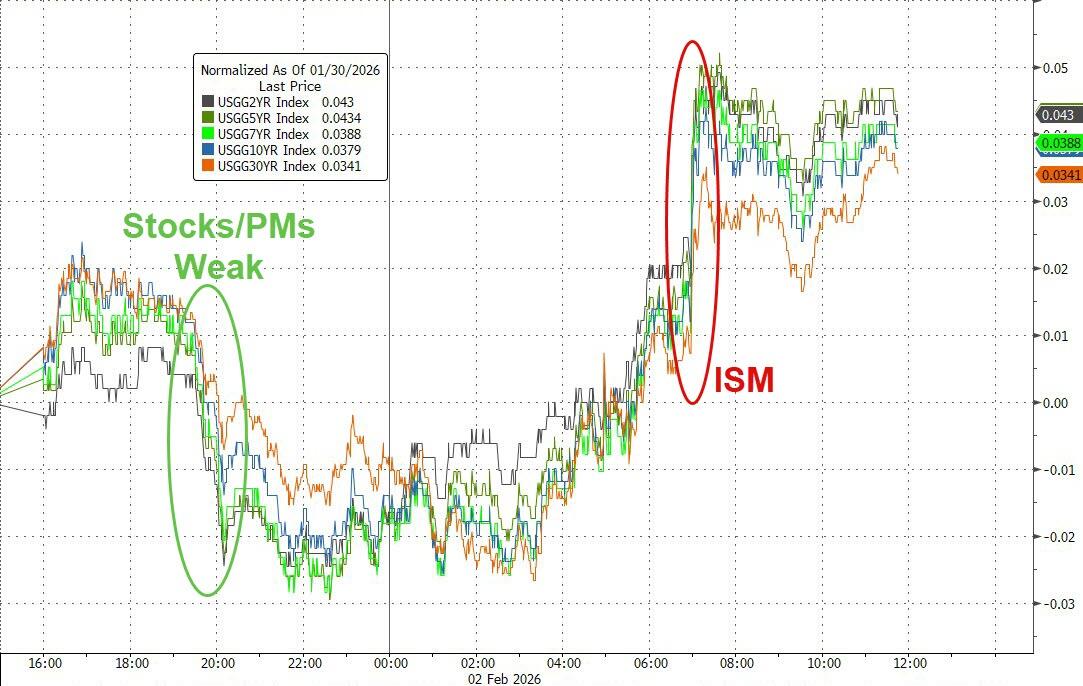
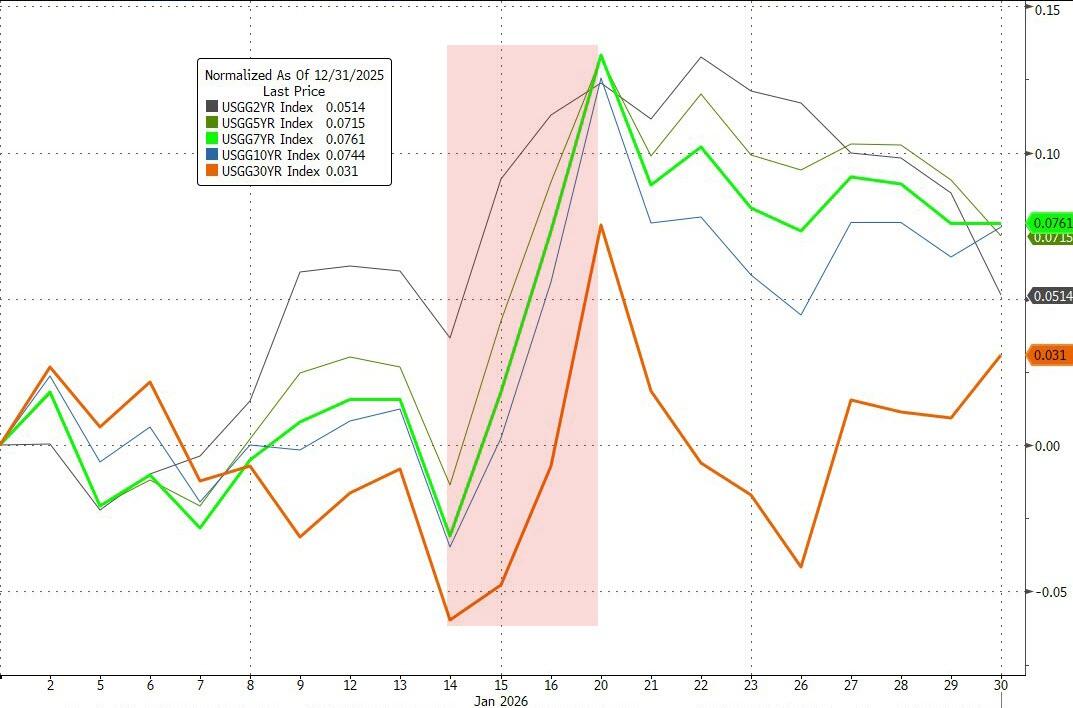
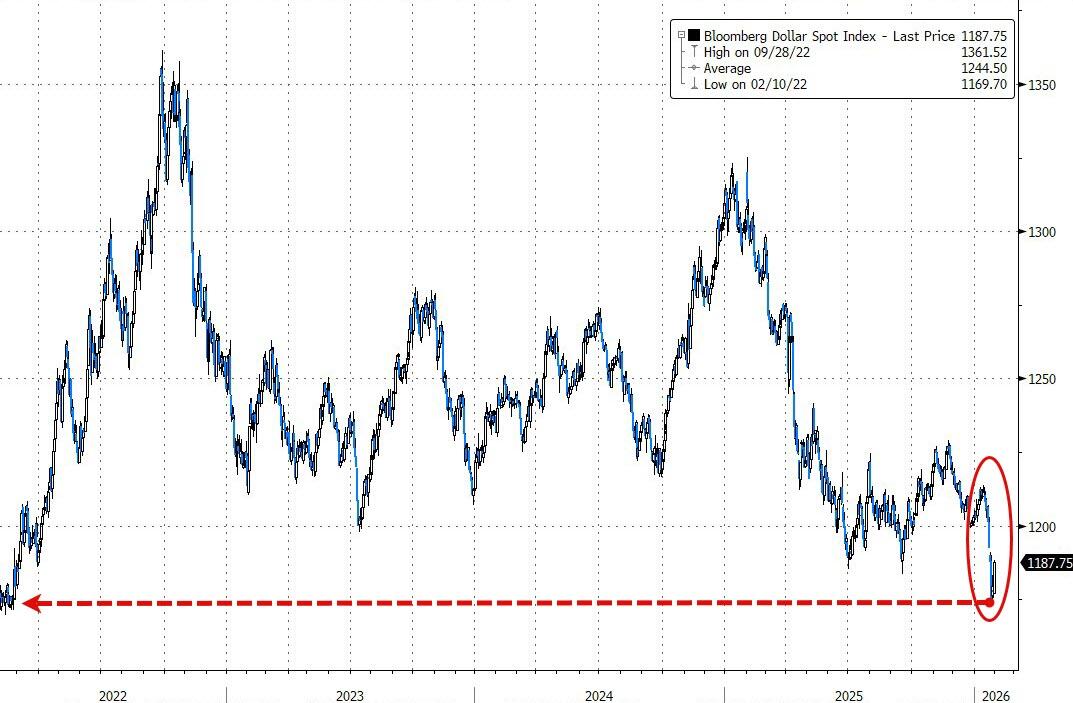
The dollar extended yesterday’s gains, bond yields dropped, and the whole move had the fingerprints of margin calls and forced deleveraging—Bitcoin being the easiest 24/7 asset to liquidate.
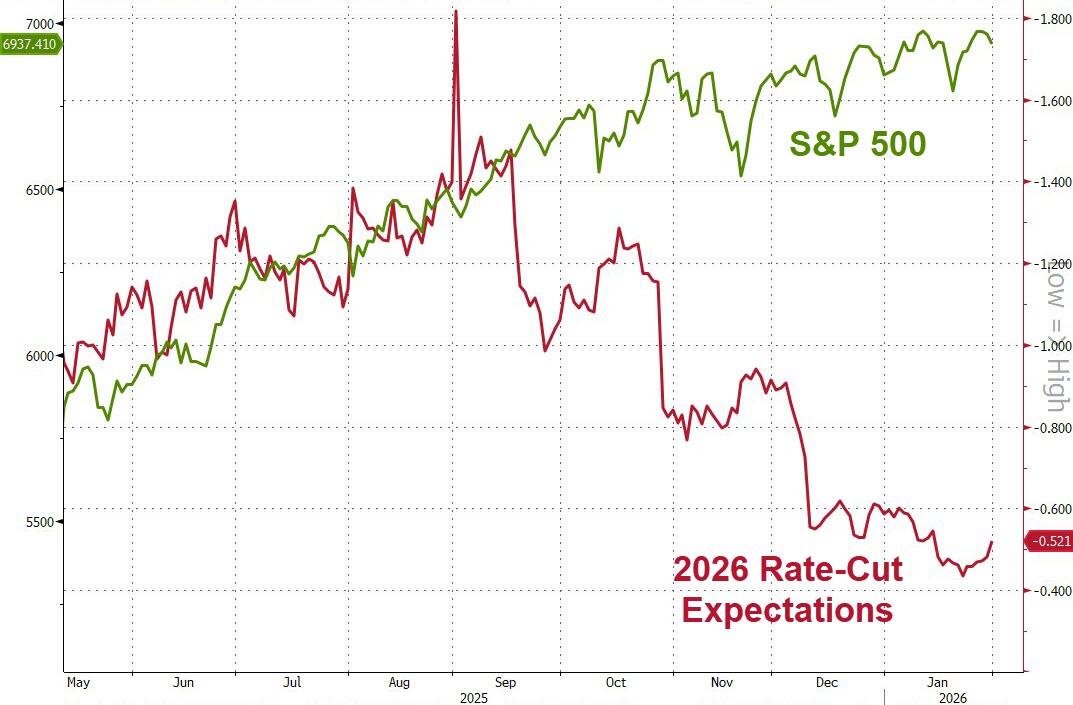
In the end, it was a violent, red-dominated day with no late recovery in sight. Breadth was ugly—only about 200 S&P 500 names stayed green.
When even the metals sell off and the bears dominate a day like this, this feels like a normal, healthy breather after a strong run… but I am wondering if the pullback might have a little more room to run before the bullish crowd steps back in?
Read More