Weekly StatSheet For The ETF/No Load Fund Tracker Newsletter – Updated Through 02/13/2014

Ulli ETF StatSheet Contact

ETF/Mutual Fund Data updated through Thursday, February 13, 2014
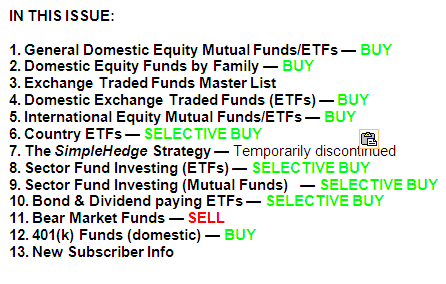
Table of Content082312

If you are not familiar with some of the terminology used, please see the Glossary of Terms.


1. DOMESTIC EQUITY MUTUAL FUNDS/ETFs: BUY — since 10/25/2011
TTI0213

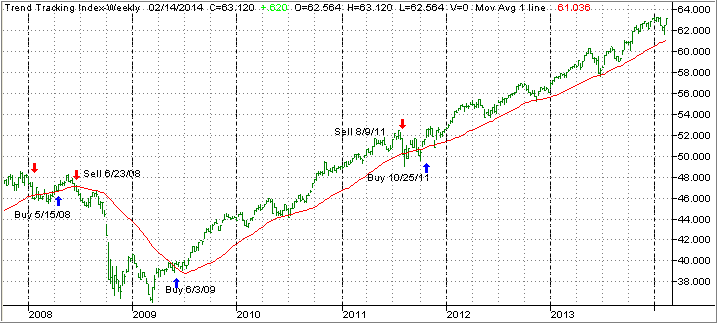
Our main directional indicator, the Domestic Trend Tracking Index (TTI), broke through its long-term trend line generating a Sell for this area effective 8/9/2011. Over the recent past, we’ve seen the TTI hovering slightly below and above this dividing line between bullish and bearish territory. The clear break to the upside occurred on 10/24/11 and, effective 10/25/11, a new Buy signal for domestic equities went into effect.

As of today, our TTI (green line in above chart) has bounced off its long term trend line (red) by +3.54%.

To avoid a potential whip-saw, a Sell signal to move out of all domestic equity positions will be generated once we have clearly pierced the line to the downside. Be sure to tune in for the latest updates.
Read More

Comcast Acquires Time Warner; New Gold ETFs Keep Surfacing

Ulli Market Commentary Contact

Thur pic

[Chart courtesy of MarketWatch.com]

1. Moving The Markets

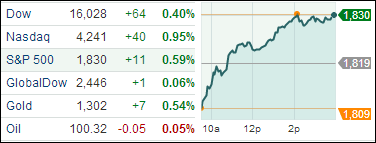
Big news for Comcast and Time Warner Cable today. Comcast (CMCSA) agreed to acquire Time Warner Cable (TWC) for $45.2 billion in stock. The closing of this deal essentially combines the two largest U.S. cable companies and creates a major obstacle for competition from phone and satellite providers.

Time Warner Cable’s stock jumped 7 percent to $144.81 at the close in New York, while Comcast fell 4.1 percent to $52.97. While this acquisition does involve two of the industry’s largest players, let’s not forget that there has been an industrywide decline in cable TV subscribers as newer Internet based content providers such as Netflix and Hulu are gaining audience. Comcast will have to find a way to compete in the modern age.

Gold settled higher today as positive technical factors outweighed a rise in investor appetite for other, riskier assets following comments by the new U.S. Federal Reserve chief about the economic outlook. Gold has gained around 7 percent since the beginning of the year benefiting by concerns about emerging markets, with China as a major focus. Remember that Gold fell 28 percent in 2013, which broke a 12-year streak of annual gains.

As more attention is turning to gold amongst the volatility seen throughout the markets this year, a number of new gold focused ETFs have emerged. Many of the funds provide gold exposure in different currency terms by utilizing gold and currency futures. Amongst the newer on the block are the Gartman Gold/Euro ETF (GEUR), the Gartman Gold/British Pound ETF (GGBP) and the International Gold ETF (GLDE). As market volatility impacts the USD, some believe that we now have unprecedented access to efficiently held gold in different currency terms to avoid undesired and concentrated exposure to a single currency.

For the sake of disclosure, I have no holdings in the above mentioned stocks/ETFs.

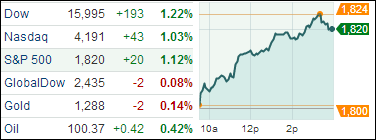
Our 10 ETFs in the Spotlight joined the rally and headed higher as you can see in the tables below.

Read More

Stocks Slip Back In The Red

Ulli Market Commentary Contact

Wed pic

[Chart courtesy of MarketWatch.com]

1. Moving The Markets

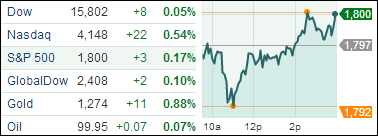
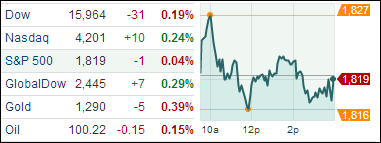
The markets here in the U.S. slipped back into the red zone across the board. The S&P 500 index fell half a point, the Dow Jones industrial average fell 0.2% and the Nasdaq composite rose 0.2%. Makers of consumer staples (XLP), a category that includes everyday products like soap, diapers and cigarettes, fell the most of the 10 sectors in the S&P 500.

The Senate’s approval suspending the debt limit became effective today as Obama signed on the dotted lines. This will allow the U.S. to meet its obligations until four months past after the next Congressional election at the end of 2014. This marks a victory for Obama and Democrats who refused to consider Republican demands to create a debt ceiling.

Treasuries fell today, pushing 10-year note yields to a two-week high. If you follow treasuries, you will know that the U.S. sold $24 billion of the securities today, just a day after Federal Reserve Chairman Janet Yellen said the central bank remains on course to taper bond purchases.

More market moving news is anticipated tomorrow as the Commerce Department’s Census Bureau will release its report on retail sales. Last month, the report indicated a 0.2% increase for December. This month, economists are expecting a 0.1% decline. The following week brings the report on housing starts and the February Flash Manufacturing PMI reading from Markit Economics. Reporting before markets open tomorrow are GNC Holdings (GNC), Molson Coors Brewing (TAP), Orbitz Worldwide (OWW), PepsiCo (PEP), Goodyear Tire & Rubber Co (GT) and Starwood Hotels & Resorts Worldwide (HOT).

Our 10 ETFs in the Spotlight changed only slightly with the exception of XLP, which is honing in on another break below its long-term trend line.

Read More

Markets Perform Well On Debt Ceiling Raise And Yellen Comments

Ulli Market Commentary Contact

Tue pic

[Chart courtesy of MarketWatch.com]

1. Moving The Markets

Equities performed well across the board today, with all 10 S&P 500 sectors closing the day with gains. Markets seemed to react positive to the news that Congress has finally agreed to advance legislation that will extend U.S. borrowing authority. Republican leaders in the House caved to President Obama’s demands to suspend the U.S. debt limit until March 2015 without conditions.

Now that we have received some clarity from Janet Yellen that the Fed plans on keeping short-term interest rates low, we can turn our attention back to gold and silver for the moment. Yellen basically told us that the Fed isn’t going to move on short-term rates until its preferred annual inflation measure moves to 2.5 percent versus its current rate of 1.1 percent.

It’s worth noting that this measure, which measures the rate of inflation on core personal consumption expenditures, hasn’t hit 2.5 percent since January 2012. So it could be a while before we see short-term rates reach higher levels.

Our 10 ETFs in the Spotlight rallied with the indexes with all of them now hovering above their respective trend lines and one of them actually made new highs for the year as the tables below show.

Read More

Markets End A Pinch Higher; A Look At Interest Rate Reaction

Ulli Market Commentary Contact

Mon pic

[Chart courtesy of MarketWatch.com]

1. Moving The Markets

Stocks etched up higher today to kick-off the week of Feb. 10.  Trading was fairly light today most likely due to the fact that Janet Yellen is scheduled to make her first congressional testimony tomorrow. Why would investors be awaiting such an event? Well, many believe that the Fed might be having reservations about the tapering issue, especially after the lackluster jobs report that was issued last Friday.

Tesla was a top gainer today as the Chinese government made an announcement that it will extend subsidies for electric car manufacturers. The stock finished up 5.38% for the day and is now up 24% for the year. Alexion Pharmaceuticals (ALXN) had a heavy day of trading and gained 3% to a new high after its recently announced strong earnings report.

As we all know, U.S. stocks and emerging markets have been volatile thus far in 2014. How have domestic interest rates been reacting to this?  Interest rates have been following stocks lower. Now, the benchmark 10-year note is yielding 2.7%, which is a decline of roughly 30 bps since the beginning of 2014. This makes sense, because investors who are pulling out of the perceived risky emerging markets are subsequently seeking shelter in government treasuries, thus driving rates lower. However, when rates fall there are some ETFs in the rate sensitive corners of the market that benefit, notable Utilities, Real Estate and Homebuilders. Keep an eye on these 3 sectors if both domestic and emerging market uncertainty persists.

Our 10 ETFs in the Spotlight changed only slightly with 9 of them remaining on the bullish side of their respective trend lines as the tables below show.

Read More

ETFs/Mutual Funds On The Cutline – Updated Through 02/07/2014

Ulli ETFs on the Cutline Contact

Below are the latest ETF Cutline reports, which show how far above or below their respective long-term trend lines (39 week SMA) my currently tracked ETFs/MFs are positioned.

The first report covers the ETF Master List from Thursday’s StatSheet and includes 398 ETFs, of which currently 318 (last week 301) are hovering in bullish territory.

The second report includes only High Volume ETFs. To clarify, High Volume (HV) ETFs are defined as those with an average daily volume of $10 million or higher.

These ETFs are generated from my selected list of some 93 that I use in my advisor practice. It cuts out the “noise,” which simply means it eliminates those ETFs that I would never buy because of their volume limitations. 53 ETFs (last week 48) have managed to remain in bullish territory after the recent market volatility.

The third report covers Mutual Funds on the Cutline. There are currently 603 (last week 557) above the line and 246 below it out of the 859 that I follow.

Take a look:

1. ETF Master Cutline Report     

2. ETF High Volume Cutline Report

3. MF Cutline Report

In case you are not familiar with some of the terminology used in the reports, please read the Glossary of Terms.

If you missed the original post about the Cutline approach, you can read it here.

Please note that Mutual fund prices have not been adjusted for yearend distributions.