A Shaky Morning, But Markets Recover In Afternoon Trading

Ulli Market Commentary Contact

Mon pic

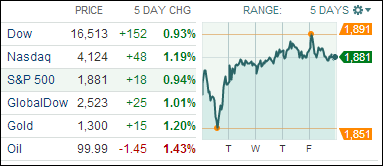
[Chart courtesy of MarketWatch.com]

1. Moving The Markets

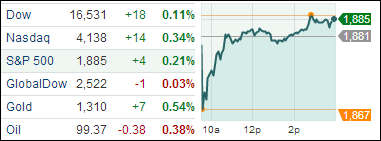
Stocks rebounded today after a shaky start this morning. All three major indexes finished in positive territory, with the Nasdaq leading the way up as the chart above shows. Earnings season is winding down, but Target (TGT) announced today that their CEO, Gregg Steinhafel, has resigned from the position effective immediately and turned over the reins to CFO John Mulligan. Shares dropped 3% today on the news. Many across the U.S. were calling for Steinhafel’s resignation shortly after the data breach that occurred during the holiday season. It shall be interesting to see who will be willing to step into the “hot seat” as CEO.

Apple (AAPL) regained ground today as its shares closed above the $600 mark for the first time since October of 2012. The stock has been performing relatively well since the company recently announced that a 7-for-1 stock split will take effect in early June.

European markets finished lower amidst continued worries over tensions in Ukraine, and Asian markets ended the day in mixed fashion as China reported contracting monthly manufacturing numbers.

Our 10 ETFs in the Spotlight inched higher, although no new highs were made new highs and 9 of them remain on the plus side YTD.

Read More

04-30-2014

Ulli Newsletter Archives Contact

The ETF/No Load Fund Tracker

Monthly Review—April 30, 2014

US Stocks Show Mixed Gains In April; Europe Fares Better

US equity indexes showed a mixed picture in April with the blue-chip Dow Jones Industrial Average and the benchmark S&P 500 heading higher.

The DJIA hit a record high for the first time this year while the S&P 500 staged only a modest advance. The Dow finished the month up 0.75 percent while the S&P 500 added 0.6%. The Nasdaq bucked the trend and lost 2%.

The US jobs market made a strong comeback in April after losing steam in the first-quarter due to unusually cold weather conditions. Data released by the Labor Department showed the economy added 288,000 jobs in April, marking the best monthly gain since January 2012. The unemployment rate dropped to 6.3 percent, the lowest since September 2008.

The labor participation rate slumped to 62.8 percent in April from 63.2 percent the prior month, matching a 35-year low. The government attributed the decline in participation rate to fewer people entering the workforce, rather than more people leaving the labor force.

The US Fed cut its monthly assets purchase program by another $10 billion to $45 billion, as was widely expected.

The consumer sentiment index rose to a final reading of 84.1 in April from 80.0 the prior month. That was the most since July and well above the 82.8 reading economists had predicted.

The Chicago business barometer revealed the Chicago purchasing managers’ index rose to 63.0 in April from 55.9 in March, marking the fastest gain in six months. Production and new orders rose sharply, indicating the economy is getting its momentum back.

Separately, a gauge for pending-home sales rose 3.4 percent in March, the most in three months, the National Association of Realtors said. That was also the first gain in nine months, indicating the decline in sales of existing homes may have found a bottom.

On the downside, growth in the first quarter nearly ground to a halt, brought about by one of the worst winters in years. GDP grew at a dismal 0.1 percent annual pace from January through March, marking the weakest performance in three years. Most economists had called for a seasonally-adjusted 1 percent increase from a 2.6 percent rise in the final three months of 2013.

Separately, data showed single-family home sales dropped by a steep 14.5 percent to a 384,000 annual pace in March, missing forecasts of an annualized gain of 450,000. That was the worst number since July last year.

Across the Atlantic, European stocks broadly tracked US equities though tensions between Russia and Ukraine continue to cloud sentiment. The pan-European Stoxx Europe 600 added 1.1 percent for April.

The constant threat of a deflationary spiral across the 18-member currency region eased somewhat as April inflation edged higher to 0.7 percent from a near four-year low of 0.5 percent in March. Inflation remained below 1 percent for the seventh month in a row.

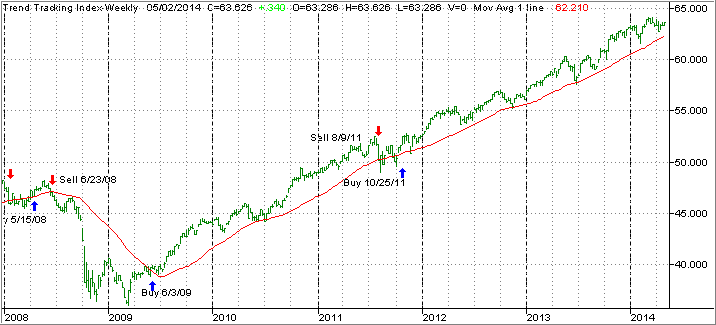
Now to the technicals: Our main directional indicator, the Domestic Trend Tracking Index (TTI), remains off its February highs but is still positioned above its long term trend line:
TTI0430

The index itself (green line) now hovers above the trend line (red) by +2.41% (last month +2.91%).

Despite the volatility in April, with the S&P 500 swinging wildly between a low of 1,816 and a high of 1,889, a spread of 73 points, none of our trailing sell stops were affected during the race to the low side. That means we will continue to hold all positions subject to their respective sell stops.

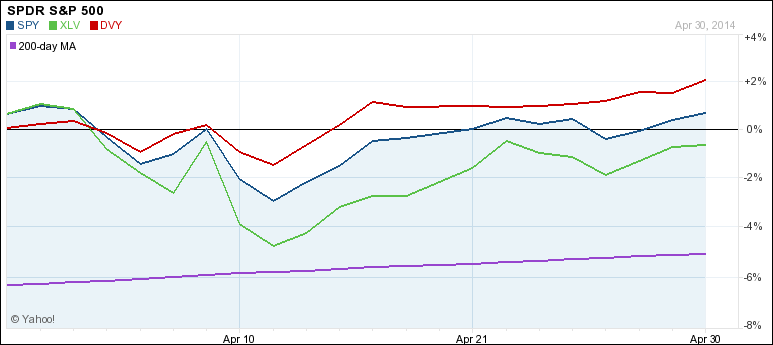
Let’s now hone into the actual volatility that out current main holdings experienced during April, which is shown in the 30-day chart below:
Monthly Chart

XLV (Healthcare) took the biggest hit but recovered nicely before its sell stop was triggered. In the end, XLV now shows a YTD gain of +5.19%, which puts in second place. Leading the pack is the DJ Divided Index (DVY), which was the most stable of this trio and leads YTD with +5.77%. The S&P 500 (SPY) hovered in the middle in regards to volatility and sports a gain of +2.41% YTD.

With the S&P 500 nibbling at its historical 1,900 level, pullbacks and rallies will continue to be part of the investing landscape. You’ll never know what might push the index above and how long that kind of a breakout might last.

Yet, at the same time, the danger of a serious pullback is ever present, and we need to be prepared to deal with either scenario. To my way of thinking, the only true measure is the long-term trend which, when combined with our trailing sell stop discipline, should limit our downside risk in the event the bears gain the upper hand again.

Right now, the major trend remains bullish, and we will stay onboard and ride it as long as it lasts.

ETFs/Mutual Funds On The Cutline – Updated Through 05/02/2014

Ulli ETFs on the Cutline Contact

Below are the latest ETF Cutline reports, which show how far above or below their respective long-term trend lines (39 week SMA) my currently tracked ETFs/MFs are positioned.

The first report covers the ETF Master List from Thursday’s StatSheet and includes 398 ETFs, of which currently 360 (last week 351) are hovering in bullish territory.

The second report includes only High Volume ETFs. To clarify, High Volume (HV) ETFs are defined as those with an average daily volume of $10 million or higher.

These ETFs are generated from my selected list of some 97 that I use in my advisor practice. It cuts out the “noise,” which simply means it eliminates those ETFs that I would never buy because of their volume limitations. 81 ETFs (last week 77) have managed to remain in bullish territory after the recent market volatility.

The third report covers Mutual Funds on the Cutline. There are currently 658 (last week 601) above the line and 191 below it out of the 859 that I follow.

Take a look:

1. ETF Master Cutline Report     

2. ETF High Volume Cutline Report

3. MF Cutline Report

In case you are not familiar with some of the terminology used in the reports, please read the Glossary of Terms.

If you missed the original post about the Cutline approach, you can read it here.

One Man’s Opinion: Can The Unemployment Rate Hit 5 Percent In The Next Three Years?

Ulli Market Review Contact

92835431The idea of gloom over the economy is slowly receding and getting the unemployment rate back to 5 percent will be considered normal, said Alan Krueger, former Chairman at the Council of Economic Advisers. Washington needs to focus on targeted efforts to the economy’s most severe problems, which now is long-term unemployment, rather than adding more stimuli, he noted.

Asked if it was okay for the Fed to drop the unemployment threshold of 6.5 percent before initiating tightening, Alan said it was not prudent because the unemployment rate is still one of the best economic indicators. However, market participants also need to look at the whole picture; i.e. what’s happening to labor participation rate and work hours etc.

The headline unemployment rate will still remain supreme, despite being incomplete, because all other indicators like GDP readings and so on contain tremendous amount of noise and get revised by wide margins. That is considered normal because they all run simulations where they draw the data points from the same distribution and show how different patterns emerge even with the same numbers. Everyone should consider those numbers with the appropriate grain of salt; they all indicate where the economy is going but one should not overreact to them, he observed.

Read More

New ETFs On The Block: Powershares Variable Rate Preferred Portfolio ETF (VRP)

Ulli Income ETFs Contact

90272538PowerShares, the exchange-traded fund unit of Invesco and the fourth-largest sponsor of ETFs in the US, launched the PowerShares Variable Rate Preferred Portfolio ETF (VRP) on May 1. The fund is US’s first variable rate preferred stock ETF product.

Preferred stocks have been the toast of institutional investors due to their potential for price appreciation and impressive dividend yields. Yet the slow and inevitable rise in yields has exposed these securities’ key investment risk: like other fixed income securities that pay a preset coupon over long horizons, they can slide in value and offset income gains they produce.

A study by Merrill Lynch showed in the eight months, since Ben Bernanke announced the end of Federal Reserve stimulus, traditional preferred stocks shed 10 percent of their value. To counter this problem, a fairly new type of preferred stocks was introduced by corporations, known as variable rate preferreds or VRPs. The same study showed VRPs lost 5 percent, or half the rate of traditional preferreds, in the final eight months of 2013. You should note that most of the returns from fixed-income securities usually come from the coupons.

Read More

05-02-2014

Ulli Newsletter Archives Contact

ETF/No Load Fund Tracker Newsletter For May 2, 2014

ETF/No Load Fund Tracker StatSheet

————————————————————-

THE LINK TO OUR CURRENT ETF/MUTUAL FUND STATSHEET IS:

https://theetfbully.com/2014/05/weekly-statsheet-for-the-etfno-load-fund-tracker-newsletter-updated-through-05012014/

————————————————————

Market Commentary

Friday, May 2, 2014

MARKETS UP OVERALL FOR THE WEEK ON STRONG JOBS DATA

Fri pic

[Chart courtesy of MarketWatch.com]

1. Moving The Markets

While markets slid a bit today, all three major indexes posted gains for the week as the 5-day chart above shows. The key market driver today was the much anticipated jobs report, which revealed better-than-expected data; at least on the surface. The fact that the 2 surveys used, namely the household and establishment surveys, showed a huge divergence was conveniently overlooked.

Be that as it may, data showed U.S. job growth picked up at its fastest pace in more than two years in April, suggesting a sharp rebound in economic activity early in the second quarter. Factory orders — up a strong 1.1% for March — offered another dose of good economic news but not enough to power an earlier rally through the session’s closing bell.

Healthcare shares were among the biggest strains on the market today, including U.S. drug maker Pfizer Inc (PFE) whose shares fell 1.3% after its sweetened bid for AstraZeneca Plc (AZN) was rejected.

In Asia, Japan’s Nikkei index ticked down 0.2% to 14,457.51 and share prices fell in Singapore and Indonesia, while they rose in Malaysia, Thailand and the Philippines. The international realm is acting very unpredictable at present, especially with tensions heating up between Russia and the Ukraine.

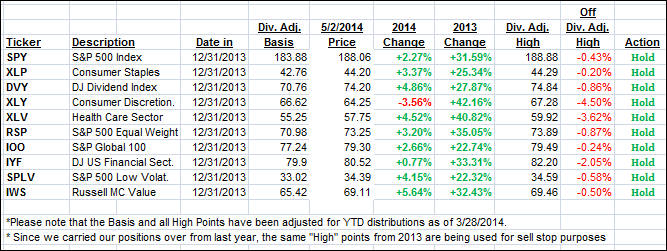
Our 10 ETFs in the Spotlight recovered during this rebound week; none of them made new highs today but 9 of them are on the plus side YTD.

2. ETFs in the Spotlight

In case you missed the announcement and description of this section, you can read it here again.

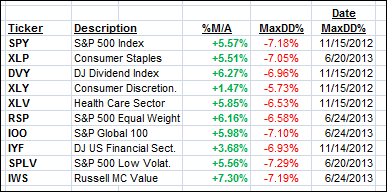
It features 10 broadly diversified ETFs from my HighVolume list as posted every Monday. Furthermore, they are screened for the lowest MaxDD% number meaning they have been showing better resistance to temporary sell offs than all others over the past year.

In other words, none of them ever triggered their 7.5% sell stop level during this time period, which included a variety of severe market pullbacks but no move into outright bear market territory.

Here are the 10 candidates:

MaxDD

All of them are in “buy” mode, meaning their prices are above their respective long term trend lines by the percentage indicated (%M/A).

Year to date, here’s how the above candidates have fared so far:

YTD

To be clear, the first table above shows the position of the various ETFs in relation to their respective long term trend lines (%M/A), while the second one tracks their trailing sell stops in the “Off High” column. The “Action” column will signal a “Sell” once the -7.5% point is taken out in the “Off High” column.

3. Domestic Trend Tracking Indexes (TTIs)

Our Trend Tracking Indexes (TTIs) bounced back and remain above their respective long-term trend lines by the following percentages:

Domestic TTI: +2.42% (last Friday +1.86%)

International TTI: +3.61% (last Friday +2.74%)

Have a great weekend.

Ulli…

Disclosure: I am obliged to inform you that I, as well as advisory clients of mine, own some of these listed ETFs. Furthermore, they do not represent a specific investment recommendation for you, they merely show which ETFs from the universe I track are falling within the guidelines specified.

————————————————————-

READER Q & A FOR THE WEEK

All Reader Q & A’s are listed at our web site!
Check it out at:

http://www.successful-investment.com/q&a.php

A note from reader Don:

Q: Ulli: When I subtract the dividend for an ETF from the high close for sell stop purposes, the sell stop is sometimes considerably less than it would be if I deducted the 7.5% from the high close. Am I right to use the high close less the dividends to compute the sell stop?

A: Don: Yes, when the price of an ETF is reduced by the amount of the dividend paid, you need to adjust the former high price by the same amount. Otherwise, your sell stop discipline is out of whack.

———————————————————-

WOULD YOU LIKE TO HAVE YOUR INVESTMENTS PROFESSIONALLY MANAGED?

Do you have the time to follow our investment plans yourself? If you are a busy professional who would like to have his portfolio managed using our methodology, please contact me directly or get more details at:

https://theetfbully.com/personal-investment-management/

———————————————————

Back issues of the ETF/No Load Fund Tracker are available on the web at:

https://theetfbully.com/newsletter-archives/