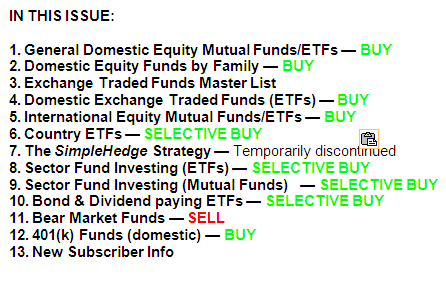
The ETF/No Load Fund Tracker
Monthly Review—June 30, 2014
US Stocks End Quarter Higher; Europe Logs Gain For The Fourth Straight Quarter
US equities extended their winning streak in June, finishing the second quarter on a high note although all the three leading indexes finished a tad short of fresh records.
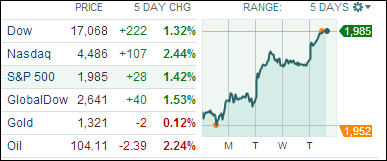
The Dow Jones Industrial Average ended up 1.9 percent for the month and 2.2 percent for the quarter. The blue-chip index added a modest 1.5 percent for the first half of 2014.
The S&P 500 closed at 1,960.19, adding 1.9 percent for June. The benchmark index logged gains for a fifth straight month and rose 4.7 percent over the quarter, the biggest second-quarter gain since 2009.
The NASDAQ Composite Index closed out at 4,408.18, picking up 3.9 percent for June. The tech-heavy index rose nearly five percent for the quarter.
Although the broader US economy showed signs of improvement, there were areas of concern that indicated recovery continues to remain uneven. Financial market reaction seemed confused, apparently torn between the first quarter’s weak economic data and the seeming rebound in the second quarter.
The US job market made a strong comeback in the second quarter, leading the economy’s recovery. Data released by the Labor Department showed the economy added 288,000 jobs in June following a 224,000 gain the prior month. The jobless rate dropped to 6.1 percent, the lowest since September 2008. However, looking under the hood, the data was far from being overwhelming as 500,000 fulltime jobs were lost and some 800,000 part time jobs were gained, which is not exactly a positive trend.
The housing market also picked up pace with an improving labor market. The index of pending home sales published by the National Association of Realtors jumped 6.1 percent in May to an eight-month high of 103.9. Low mortgage rates, bigger inventory and an improving labor market will fuel future growth, the NAR report observed. A reading of 100 equals the average deal-activity level of 2001.
US home prices rose 1.1 percent in April, marking a second month of gains, the S&P/Case-Shiller’s 20-city composite index showed. On a seasonally-adjusted basis, the gain was a more moderate 0.2 percent across the 20 cities tracked, compared with March’s gain of 1.2 percent.
Consumer sentiment jumped to the highest level in more than six years in June, a report by the Conference Board showed. The consumer confidence index rose to 85.2 in June from a downwardly revised 82.2 the prior month, the highest since January 2008.
Factory output also expanded in June, indicating a sustained recovery in manufacturing. The Institute for Supply Management’s manufacturing index came in at 55.3 last month, little changed from May’s five-month high reading of 55.4.
On the downside, The Institute for Supply Management’s Chicago Business Barometer fell to 62.6 from 65.5 as new orders declined in June. While readings above 50 signal growth over previous months, June’s reading missed economists forecast of a reading above 64.
Gross domestic product in the first quarter shrank by an annualized 2.9 percent, the Commerce Department said June 25. US consumer spending, which accounts for more than two-thirds of the economy, rose 0.2 percent in May, falling short of forecasts.
Across the Atlantic, the Stoxx Europe 600 index ended the month at 341.86. The pan-European index rose 2.3 percent in the three months through June, marking its fourth straight month of gains.
The European Central Bank announced rate cuts in June to mitigate risks of a downward price spiral. Bank deposit rates were lowered to minus 0.1 percent while refinance rates were cut to 0.15 percent, aimed at boosting lending by the region’s commercial banks. The central bank also announced additional measures for targeted lending to small and medium enterprises and added it would begin preparations related to an asset-purchase plan shortly.
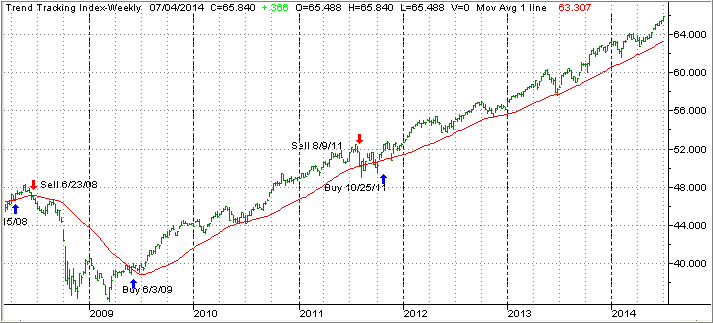
Our main directional indicator, the Domestic Trend Tracking Index (TTI) rose with the major indexes and made new highs in June:
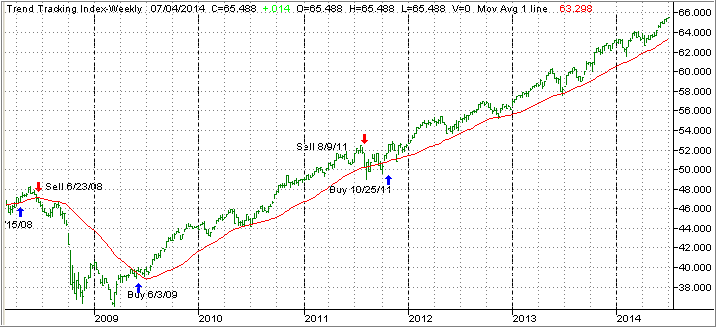
The TTI (green line) is now positioned +3.65% above its long term trend line (red), which means we are solidly entrenched in bullish territory. While there have been numerous at time embarrassing predictions as to what the markets will do, it’s best to stick with the long-term trend and take evasive action once a reversal occurs.
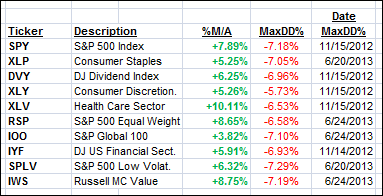
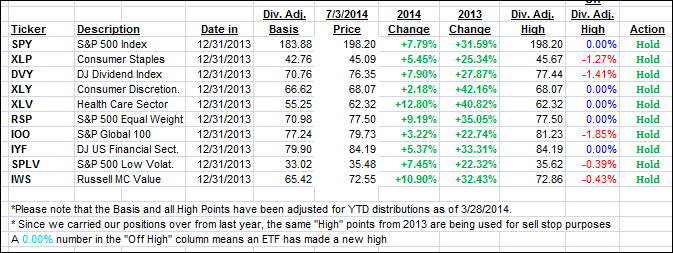
Our core holdings held pretty steady during June, as any pullbacks were not only minor but also short lived:
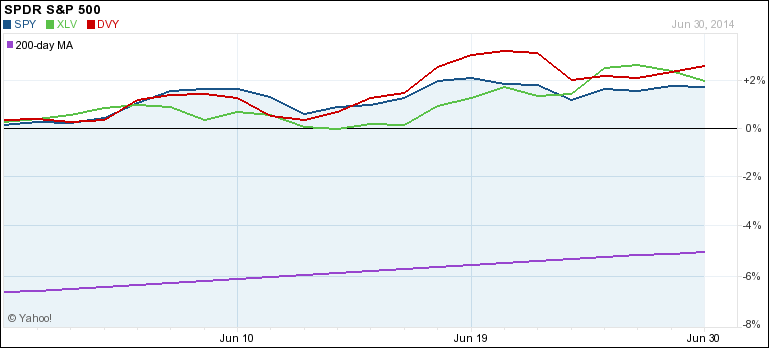
DVY and XLV showed the most movement and, in the end, DVY managed to beat the other 2 holdings by a slight margin.
It’s no secret that the primary driver for this continued bullishness is the Fed policy, especially low interest rates. If you think that these markets have reached bubble territory, you are correct. However, that does not mean a correction is imminent, but it certainly will happen at some point.
Right now, we will enjoy the ride as long as it lasts with our trailing sell stops providing the downside safety net should the current euphoria come to an end all of a sudden.

 The biggest scar from the Great Recession is going to be a smaller labor force and less investment in the US, but it will be an expansion from the previous so-called new normal level, said Alan Krueger, an economics professor at the Princeton University and former Chairman of council of economic advisers.