Do you want to know which ETFs are hot and which ones are not? Then you need my High-Volume ETF Cutline report. It tells you how close or far each of the 311 ETFs I follow is from its long-term trend line (39-week SMA). These are the ETFs that trade more than $5 million a day, so they are not some obscure funds that nobody cares about.
The report is split into two parts: The winners that are above their trend line (%M/A), and the losers that are below it. The yellow line is the line of shame that separates them. You can see how many ETFs are in each group and how they have changed since the last report (205 vs. 144 current).
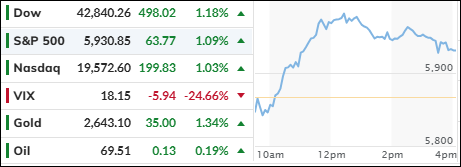
MARKETS REBOUND AMID INFLATION DATA AND LOOMING GOVERNMENT SHUTDOWN
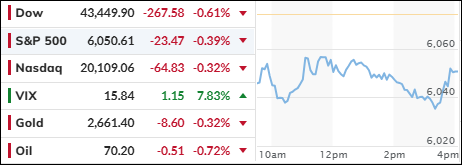
[Chart courtesy of MarketWatch.com]
Moving the market
After a challenging week, during which the Dow plummeted by approximately 1,100 points in a single day, the major indexes managed to stabilize. They rebounded immediately after the opening and recovered some of the previous day’s losses.
This recovery was supported by the Fed’s preferred inflation measure, the Personal Consumption Expenditures (PCE) index, which increased by “only” 2.4% year-over-year. This figure was slightly lower than expected, which seemed to reassure traders about the Fed’s stance on further rate cuts amid persistent inflation.
Such faint hopes often drive the bulls on Wall Street, despite ongoing concerns about inflation, especially in the context of rising debt and deficits. Additionally, the issue of government funding remains unresolved, with a partial shutdown set to begin tonight if no agreement is reached.
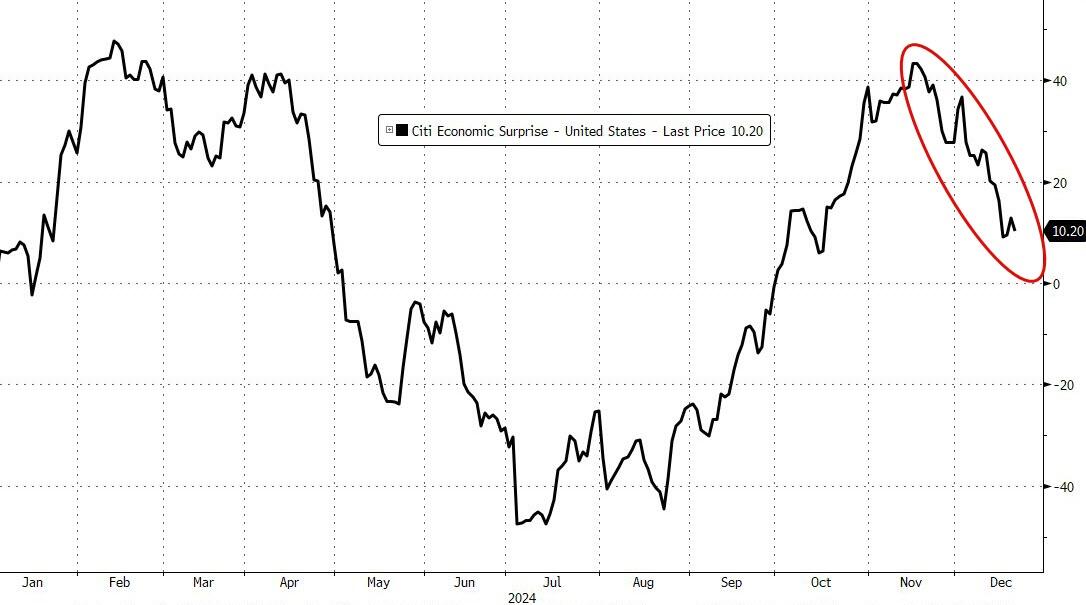
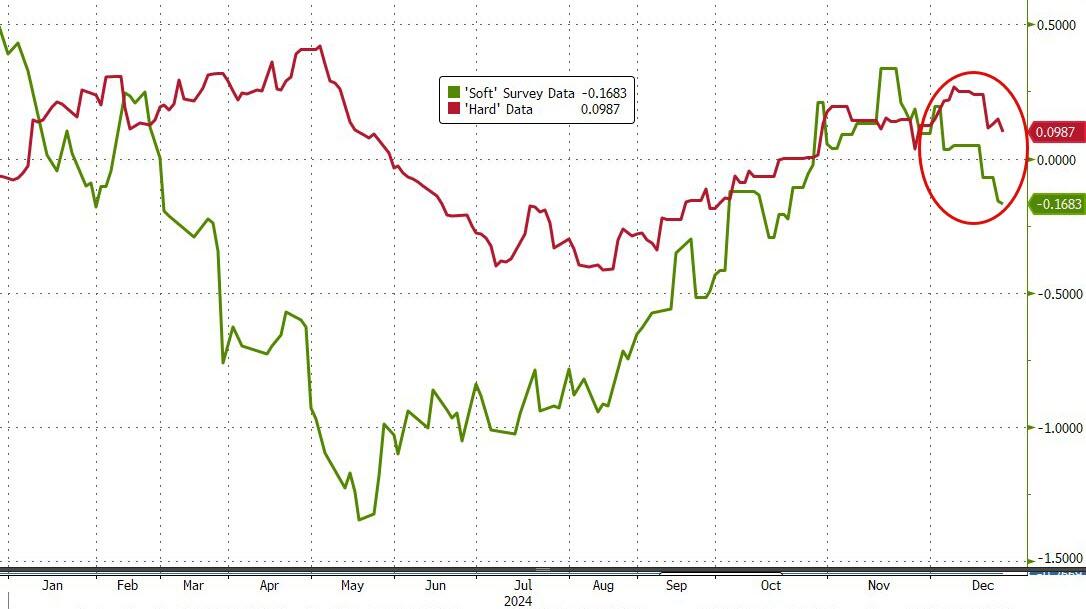
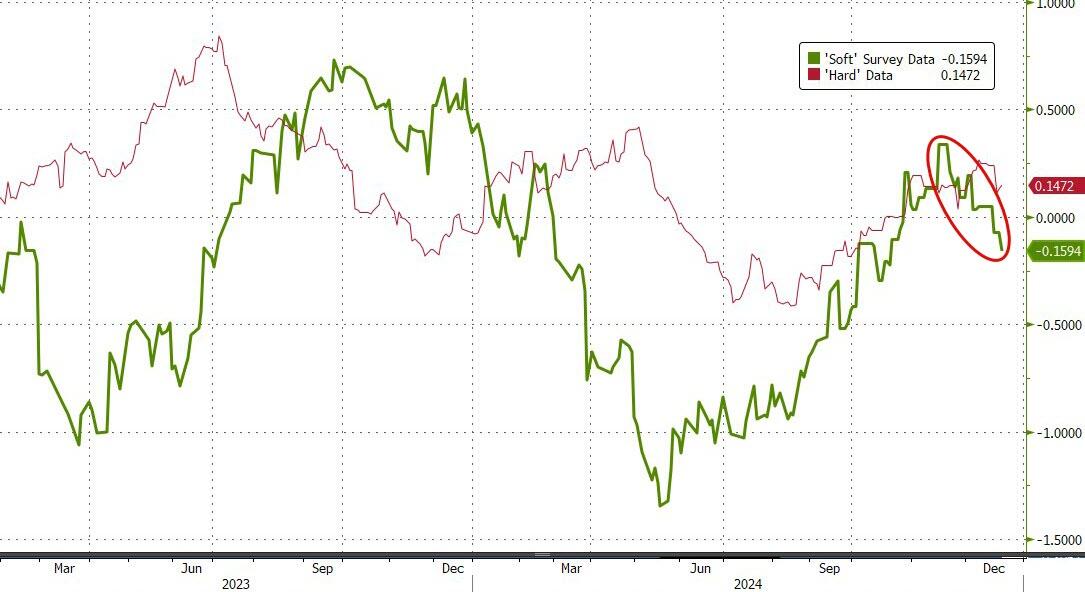
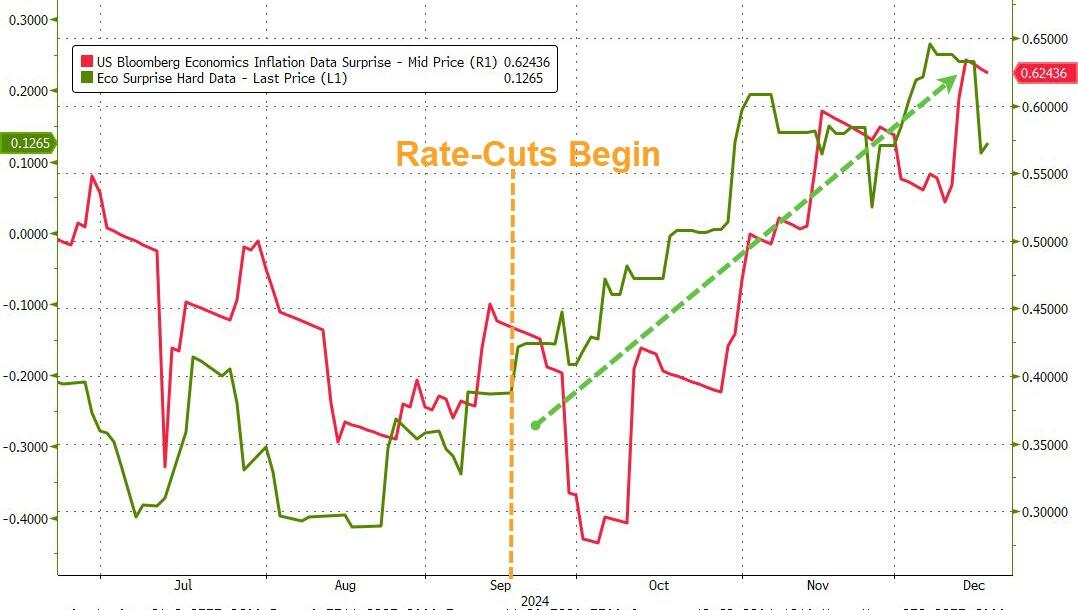
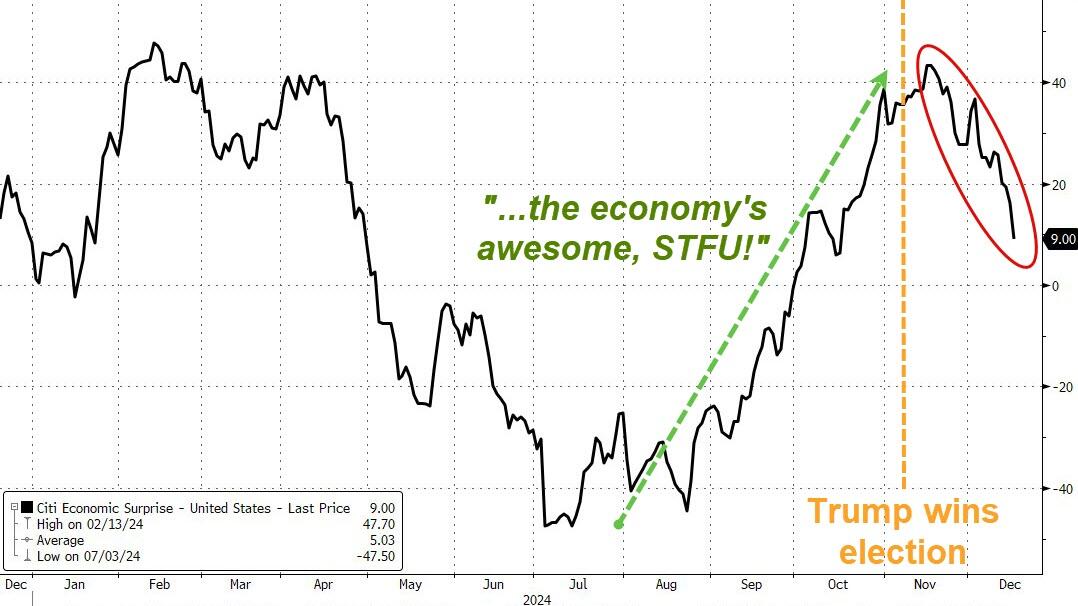
The US Economic Surprise Index fell for the fifth consecutive week, as noted by ZH, with both “soft” and “hard” data showing weakness. This prompted Chicago Fed’s Goolsbee to remark, “I’ve been saying that the overall trend is that inflation is way down.”
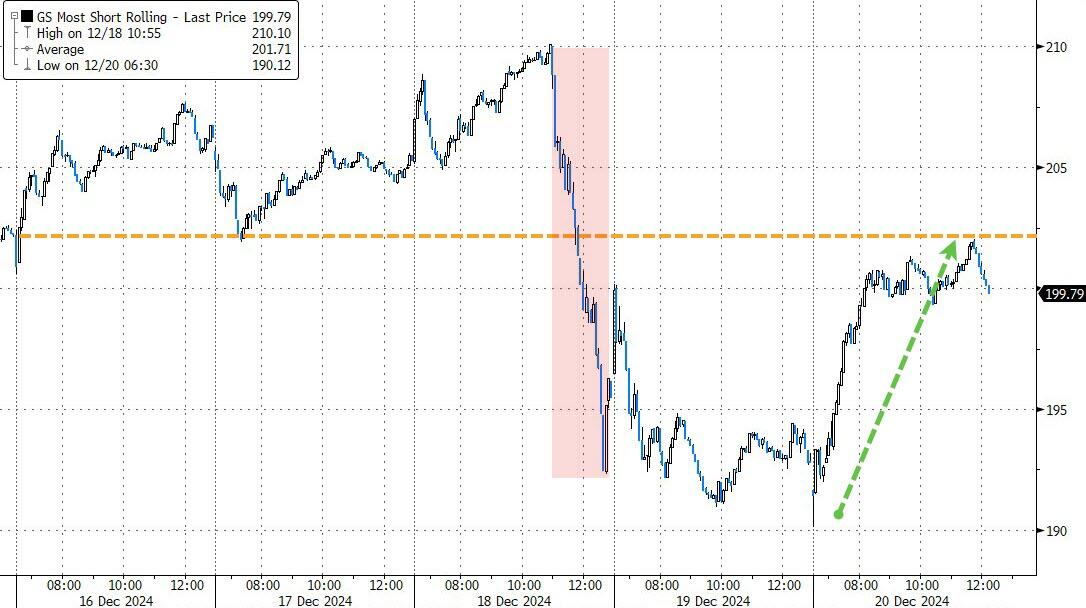
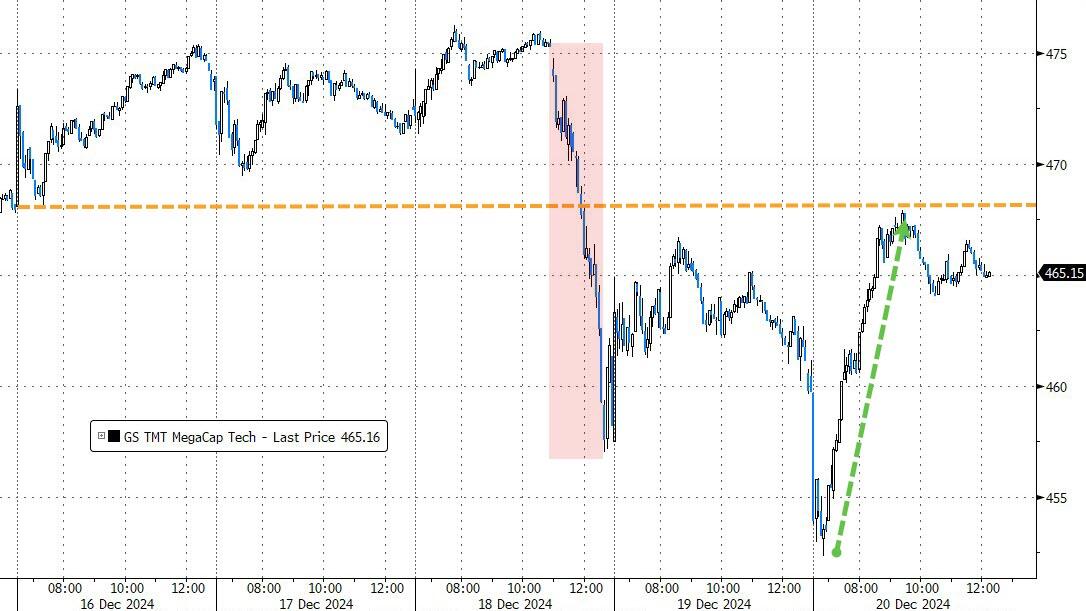
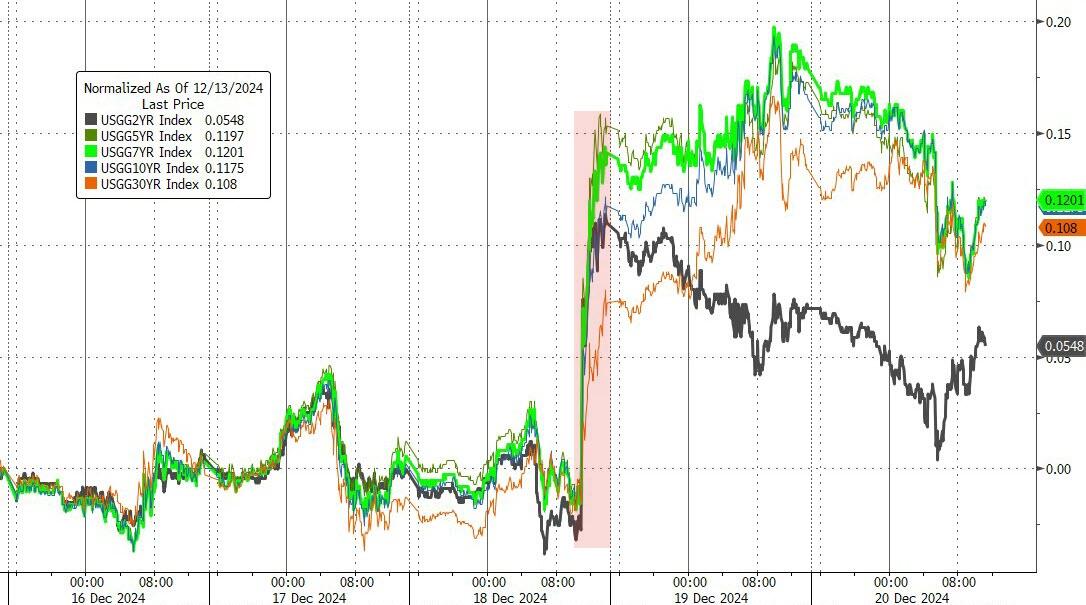
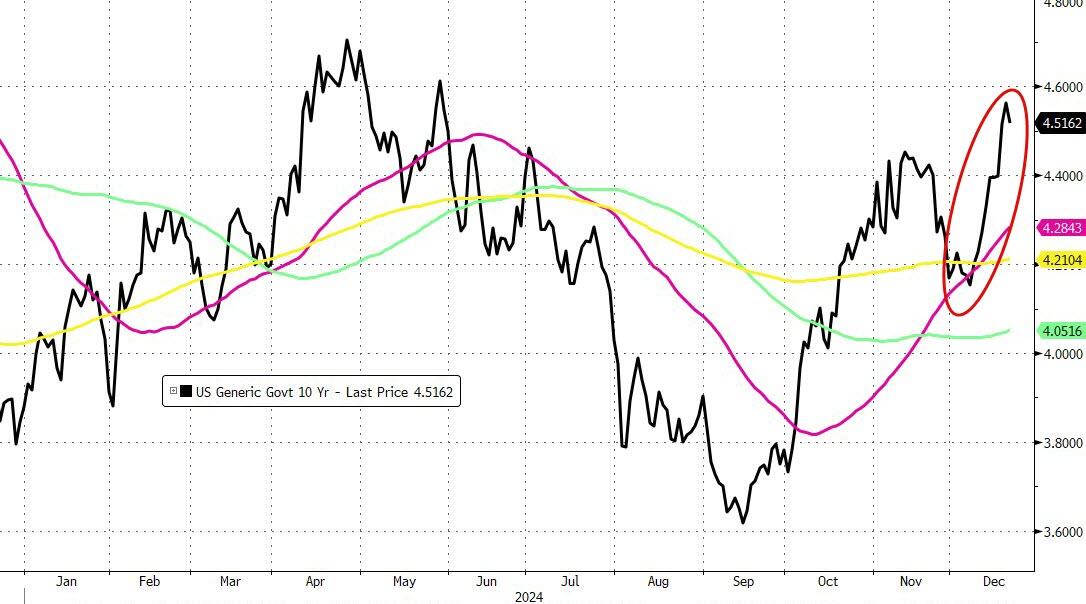
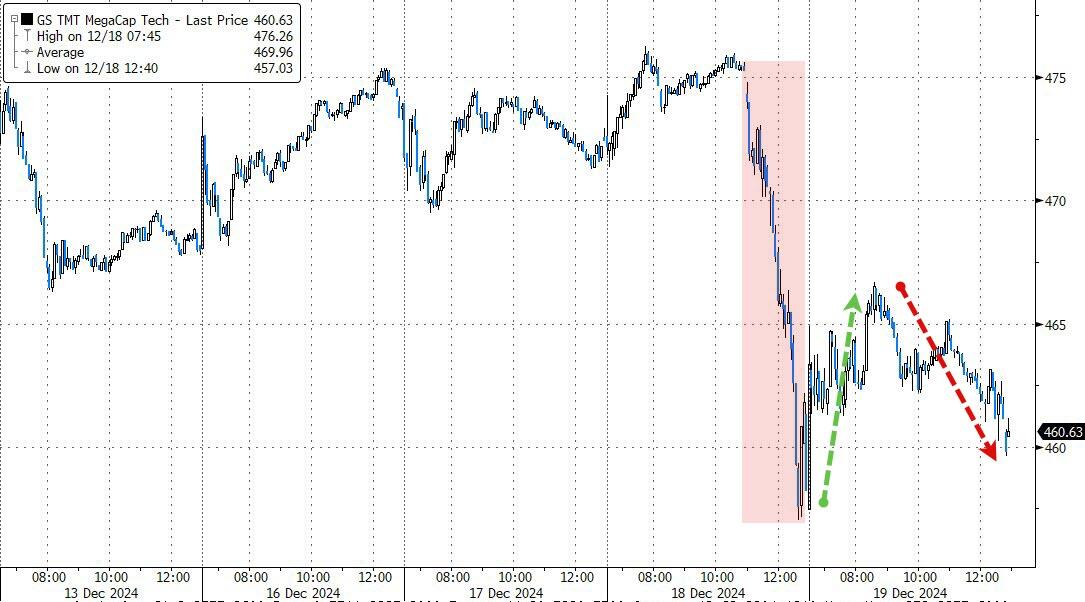
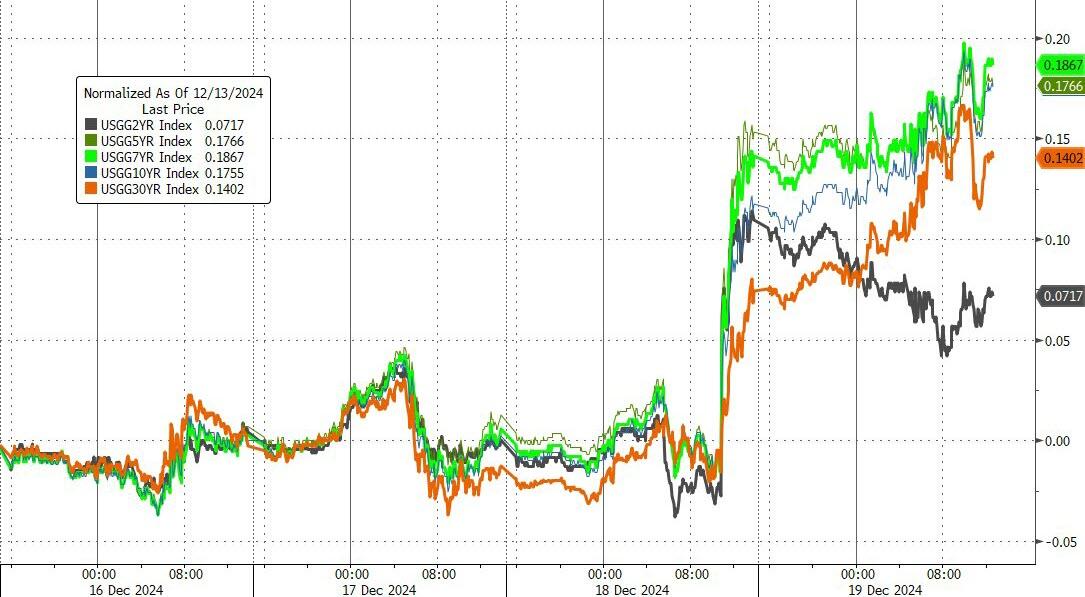
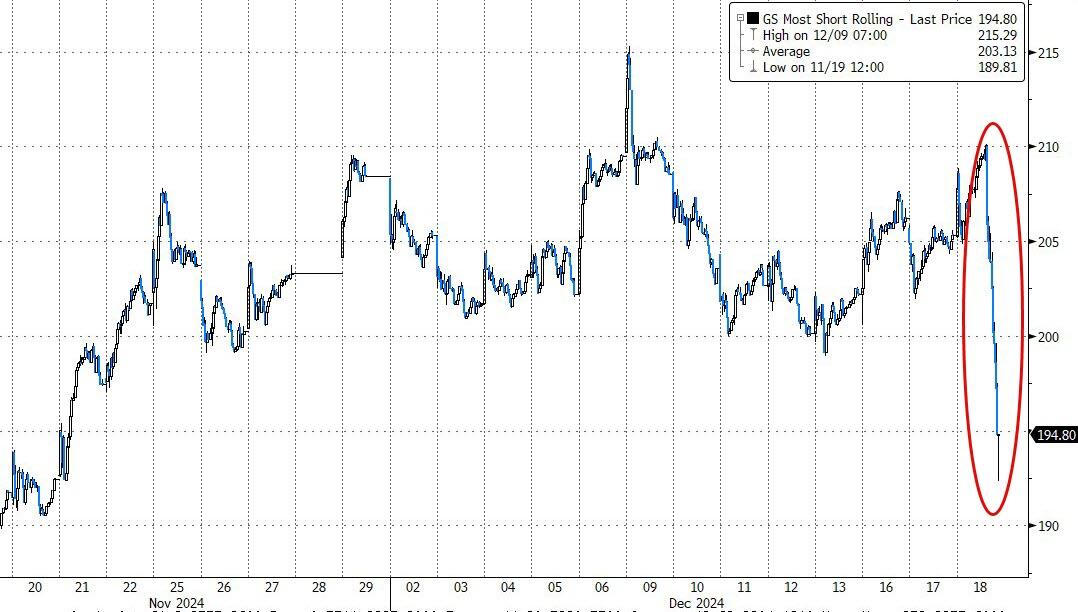
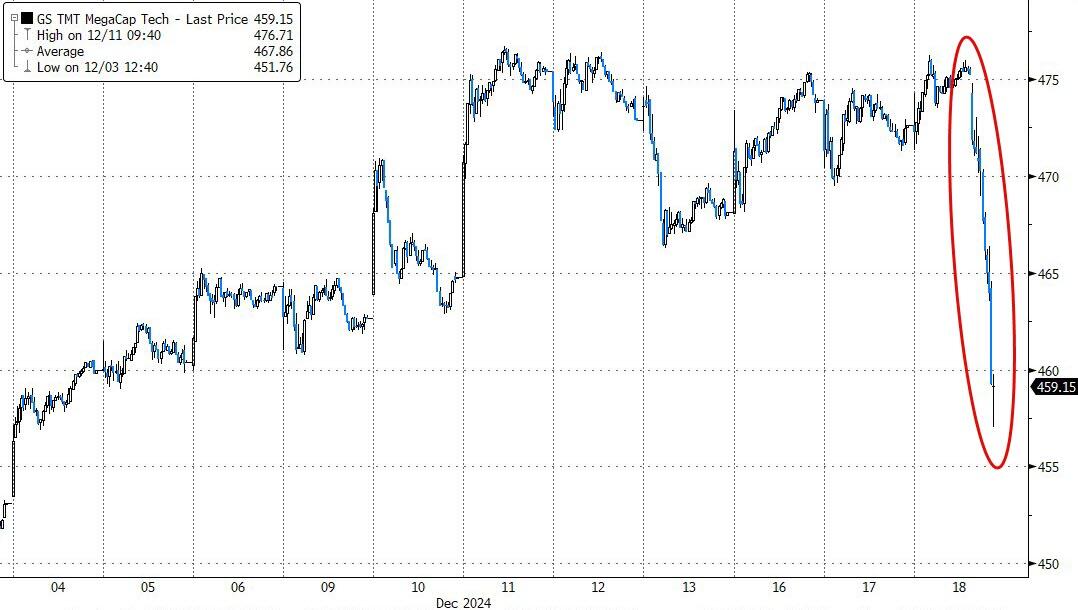
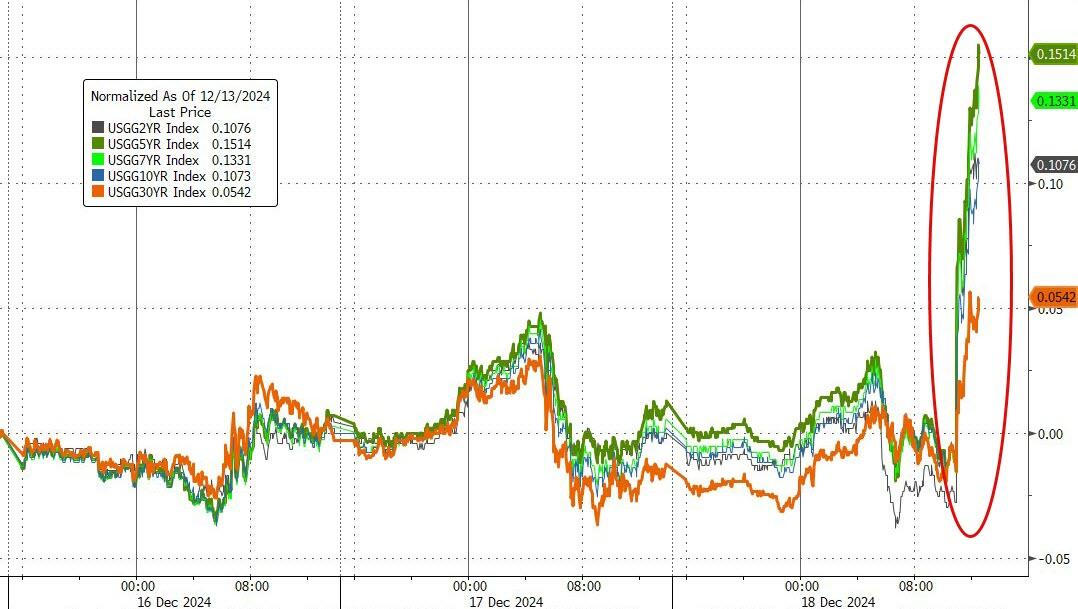
A significant short squeeze provided a boost to equities, with Mega-Caps also recovering and returning to their unchanged levels for the week. Bond yields rose sharply, with the 10-year yield climbing for the second consecutive week, ending at 4.53%.
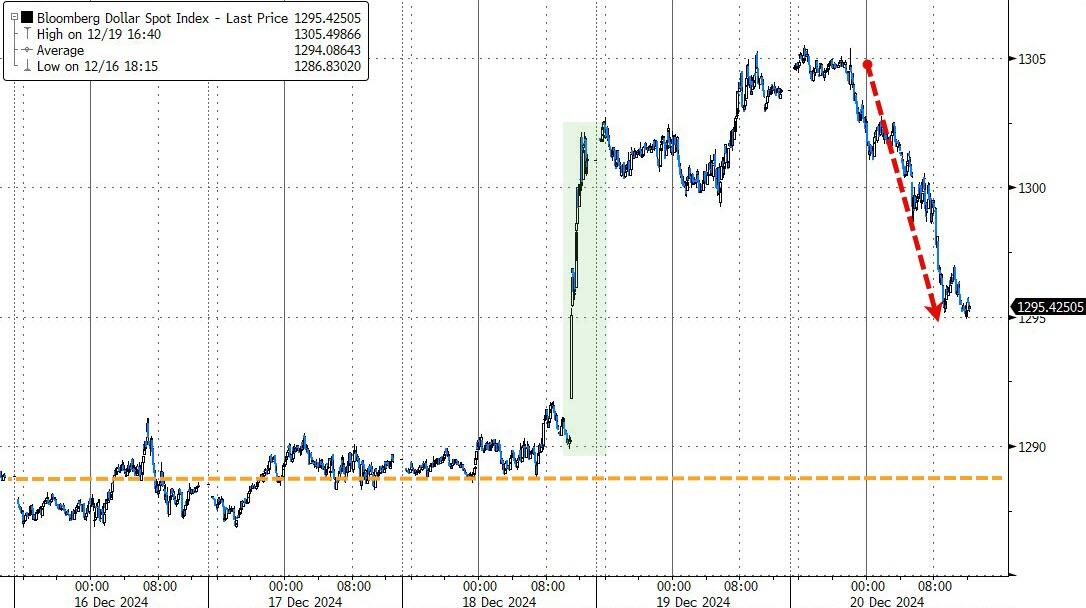
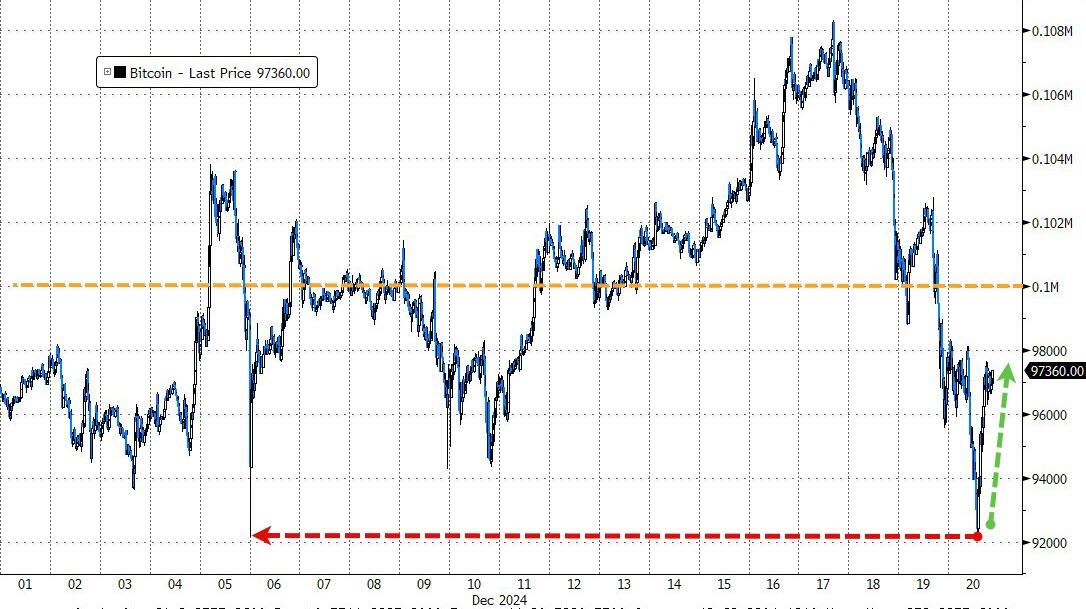
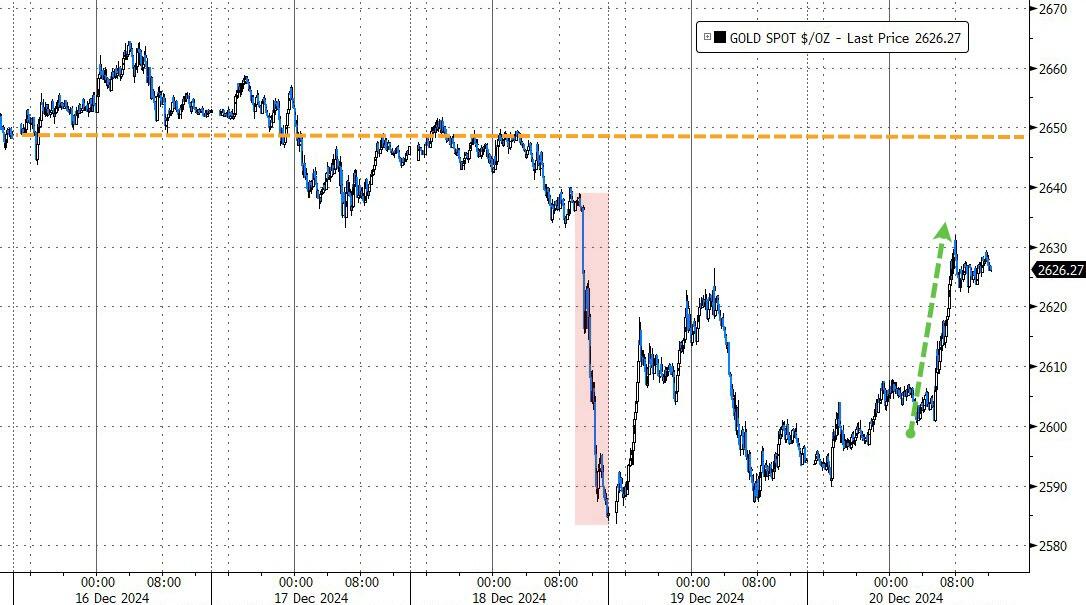
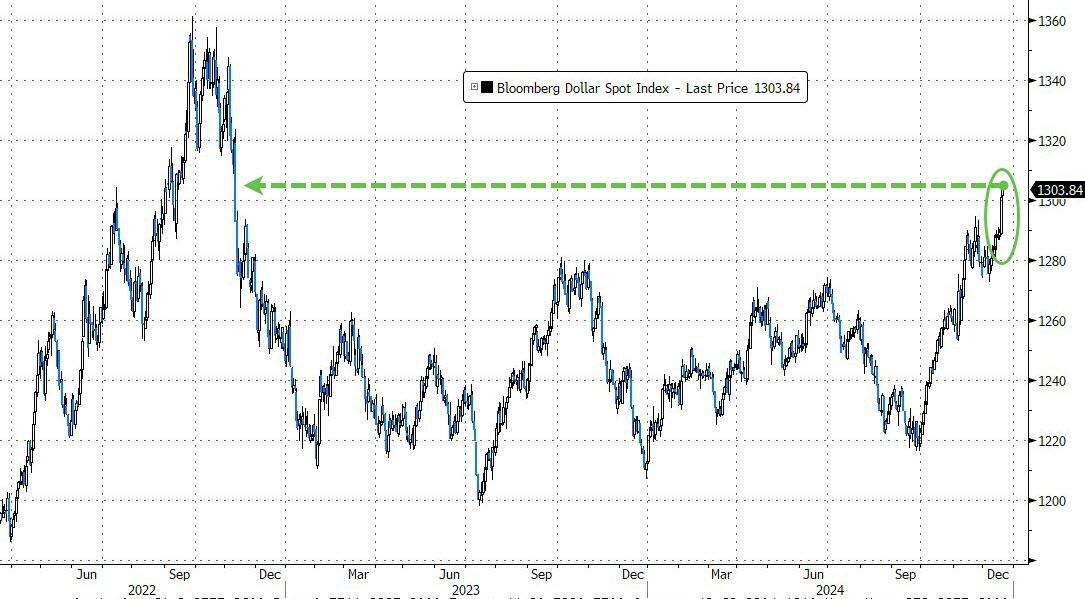
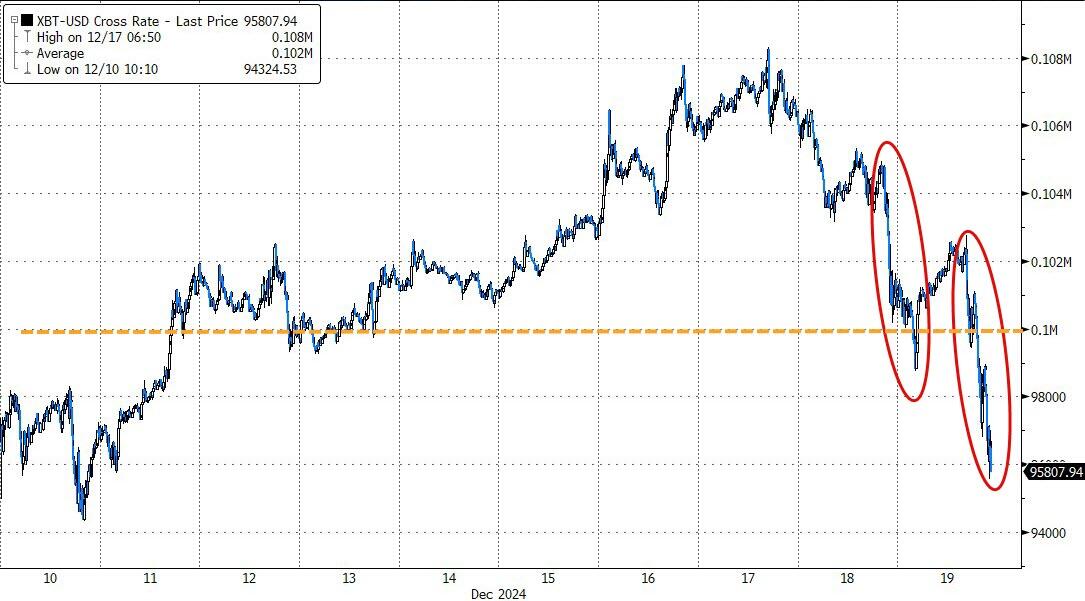
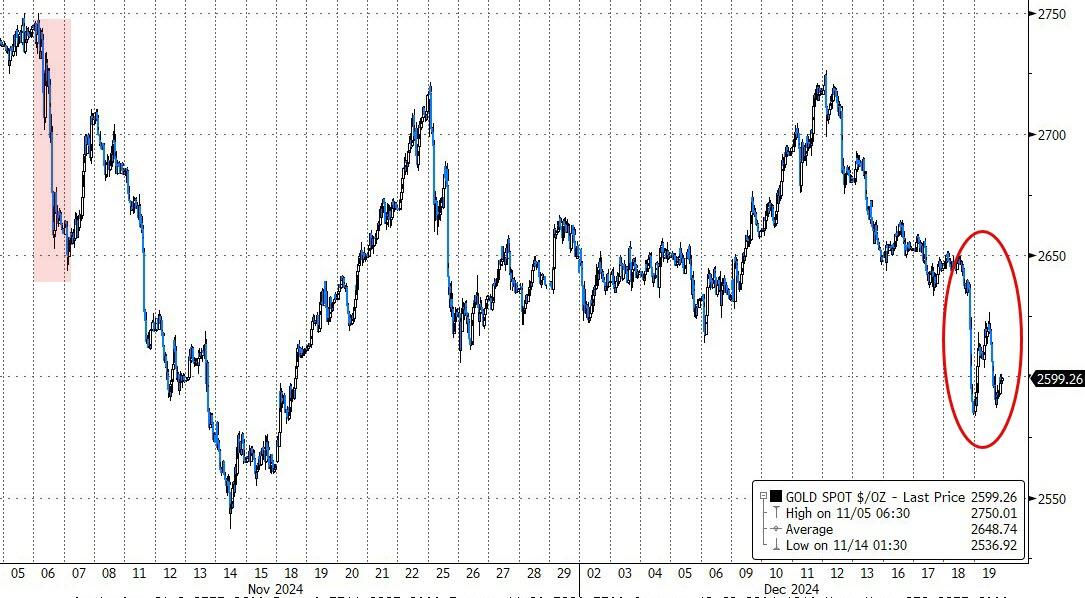
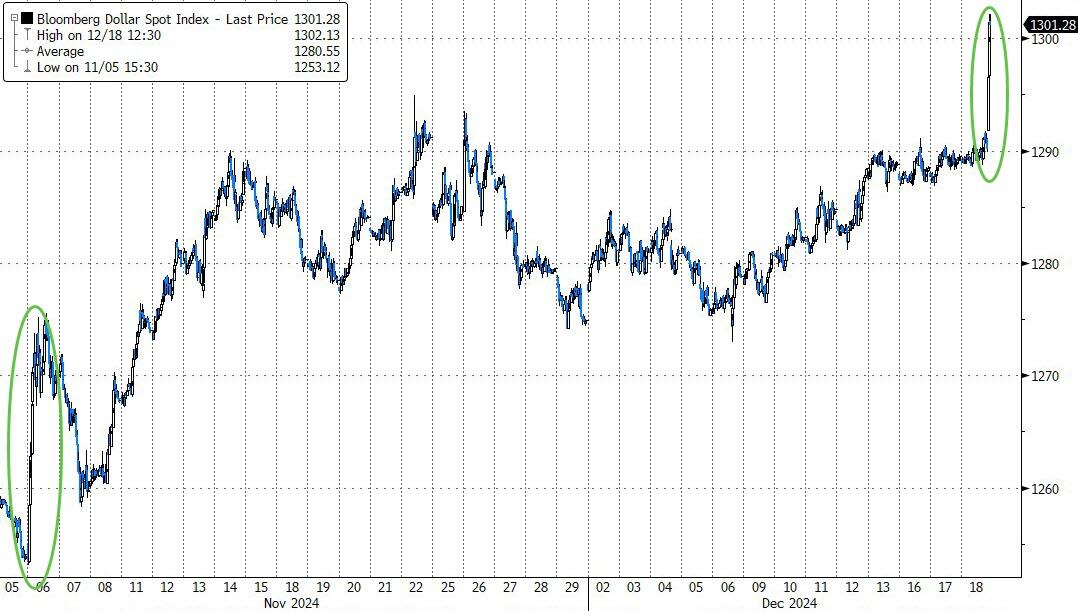
The dollar strengthened for the third week in a row, Bitcoin rebounded but had its worst week since September, and gold, although lower for the week, rallied nicely today.
With the midnight deadline rapidly approaching, the looming government shutdown remains a significant concern, making me ponder how the markets will react on Monday, should it occur.
ETF Data updated through Thursday, December 19, 2024
How to use this StatSheet:
Out of the 1,800+ ETFs out there, I only pick the ones that trade over $5 million per day (HV ETFs), so you don’t get stuck with a lemon that nobody wants to buy or sell.
Trend Tracking Indexes (TTIs)
These are the main indicators that tell you when to buy or sell Domestic and International ETFs (section 1 and 2). They do that by comparing their position to their long-term M/A (Moving Average). If they cross above, and stay there, it’s a green light to buy. If they fall below, and keep going, it’s a red light to sell. And to make sure you don’t lose your shirt if things go south, I also use a 12% trailing stop loss on all positions in these categories.
All other investment areas don’t have a TTI and should be traded based on the position of each ETF relative to its own trend line (%M/A). That’s why I call them “Selective Buy.” In other words, if an ETF goes above its own trend line, you can buy it. But don’t forget to use a trailing sell stop of 12%, or less if you’re feeling nervous.
If some of these words sound like Greek to you, please check out the Glossary of Terms and new subscriber information in section 9.
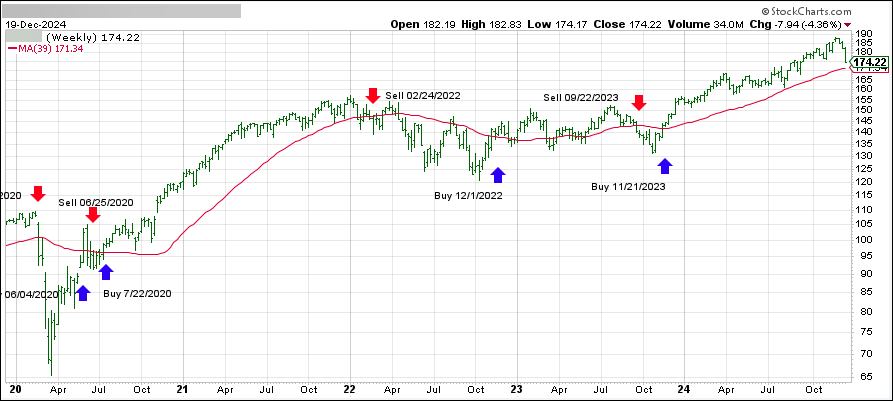
DOMESTIC EQUITY ETFs: BUY— since 11/21/2023
Click on chart to enlarge
This is our main compass, the Domestic Trend Tracking Index (TTI-green line in the above chart). It has broken above its long-term trend line (red) by +1.82% and is in “Buy” mode as posted.
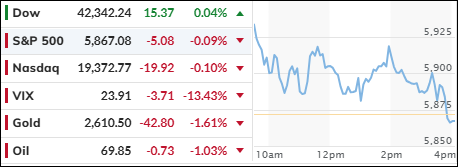
This morning, traders were still grappling with Fed Chair Powell’s hawkish comments from yesterday, indicating that he is likely to cut interest rates only twice next year, down from the four reductions forecasted in September.
The pressing question now is: what will policymakers do in 2025? If inflation worsens, as I believe it will, they may have to refrain from cutting rates altogether and possibly reverse course.
Despite this uncertainty, bullish sentiment and bargain hunters lifted the indexes out of their slump, with all three major indexes starting the session on a positive note. However, a late-day sell-off dragged the S&P 500 and Nasdaq back into the red, while the Dow managed to eke out a small gain.
The latest data releases presented a mixed picture. The final revision to Q3 GDP was strong, jobless claims were solid, and existing home sales improved. However, manufacturing continued to decline. In summary, soft data was trending downward, while hard data remained flat.
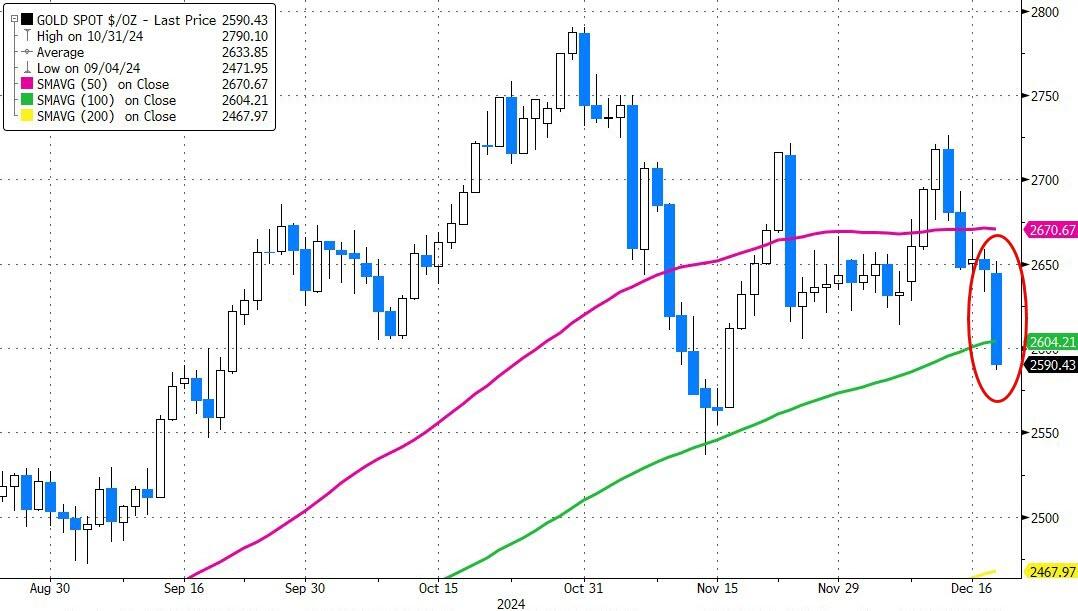
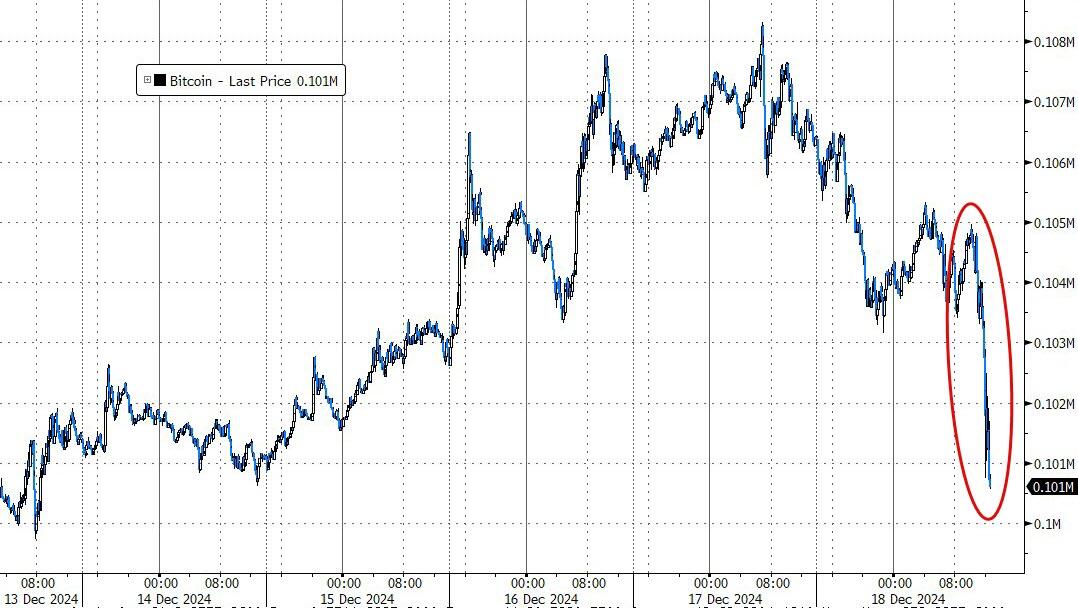
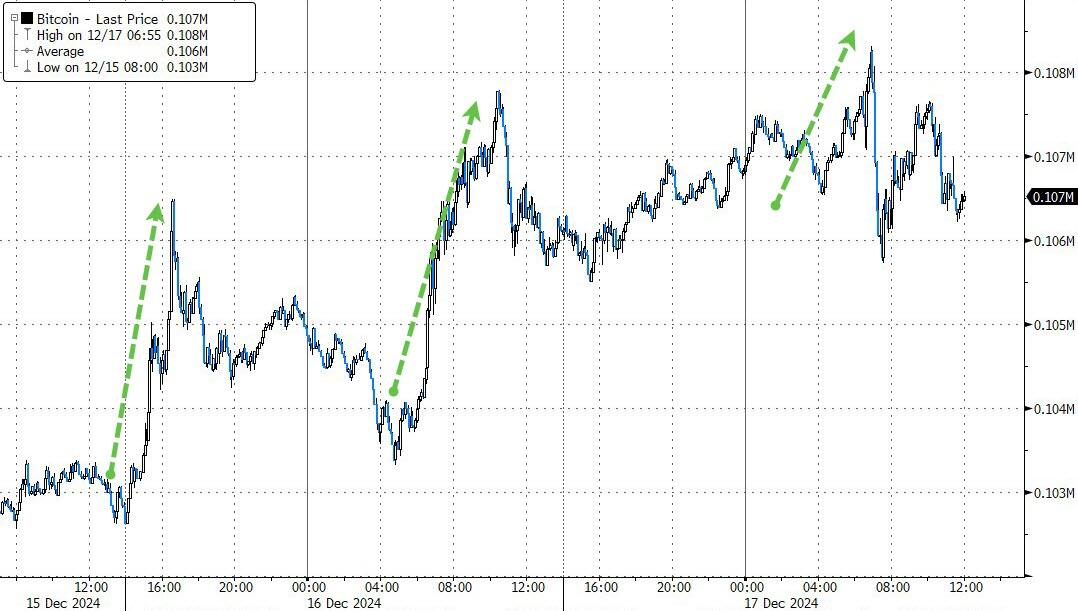
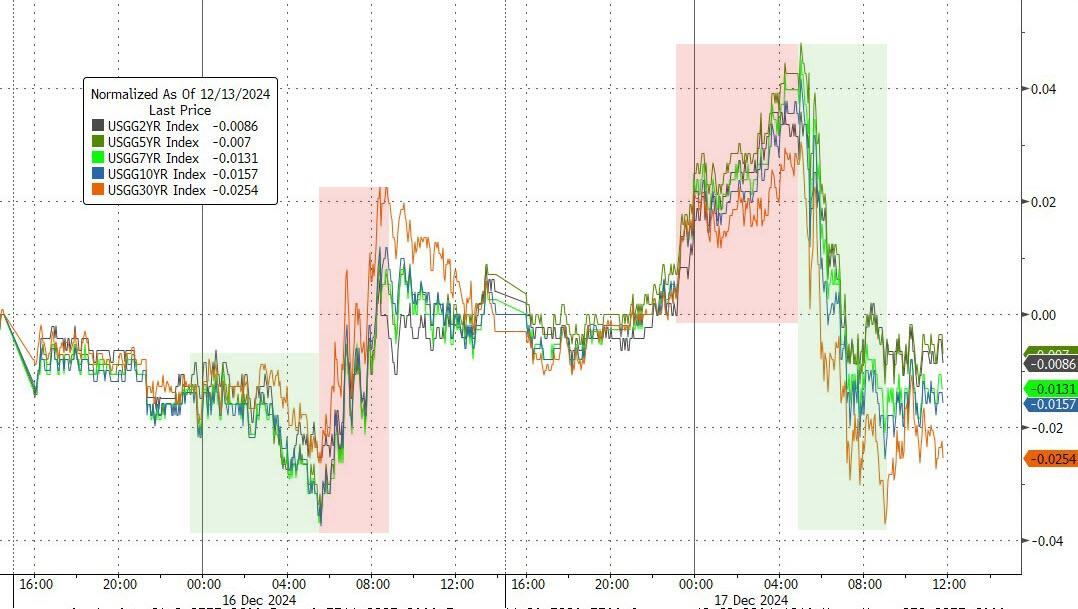
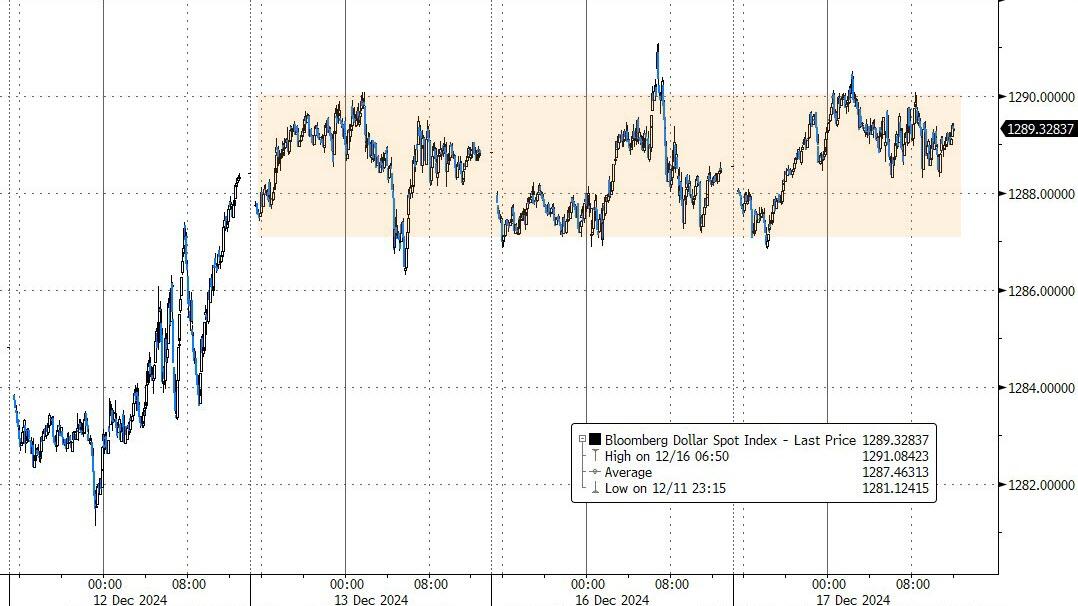
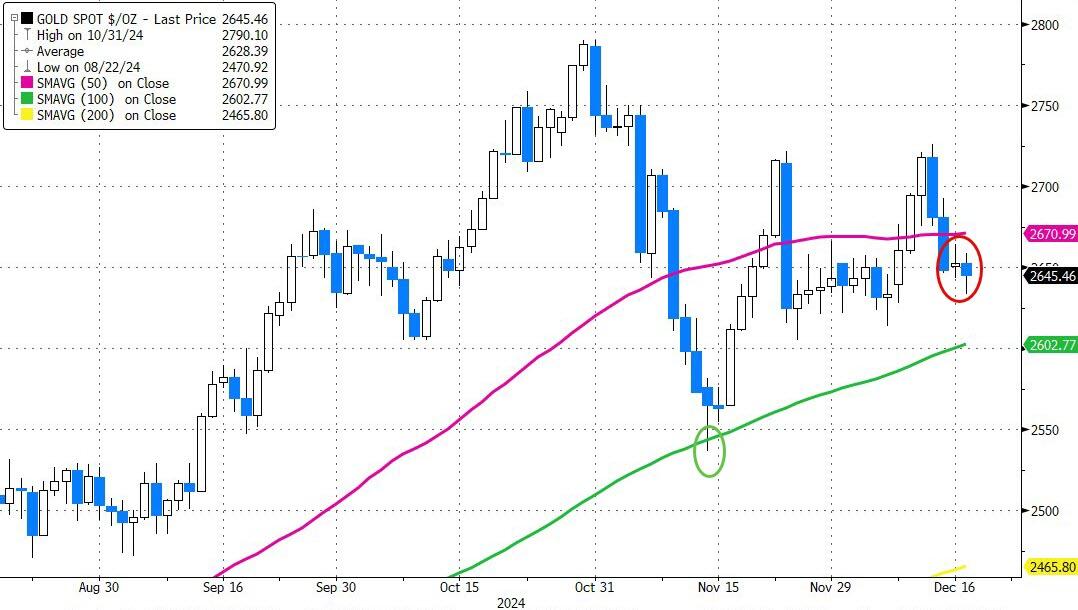
Mega Tech stocks experienced a volatile session, bond yields surged, the dollar reached two-year highs, and Bitcoin fell below the $100k mark. Gold slipped below $2,600 but rebounded to close positively.
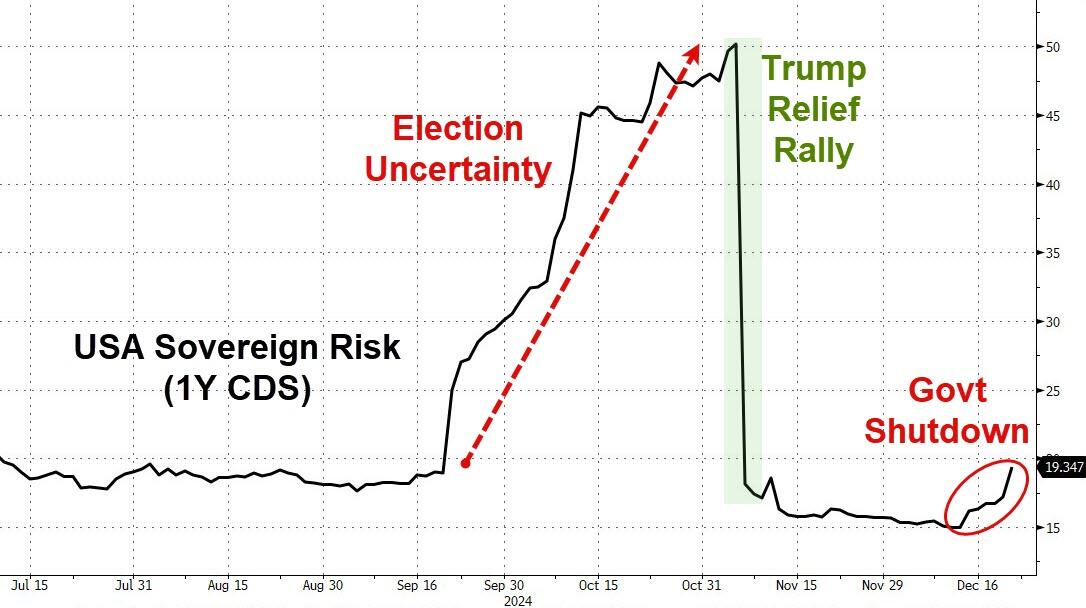
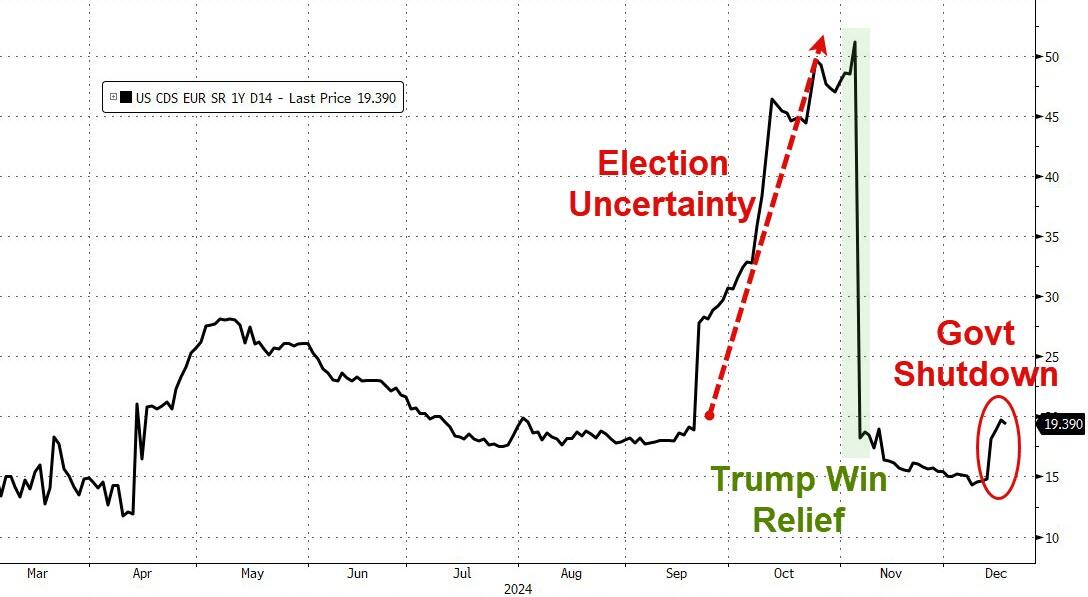
Additionally, U.S. sovereign risk of default is rising again, as highlighted by ZH, due to the potential government shutdown tomorrow night.
The major indexes edged higher ahead of the Federal Reserve’s interest rate announcement, with the Dow leading the way despite its recent worst performance in 46 years.
Although the index is less than 4% below its all-time high, a shift from “old economy” shares to the tech sector pulled the Dow down. This decline was exacerbated by the Dow’s underweighting of technology stocks.
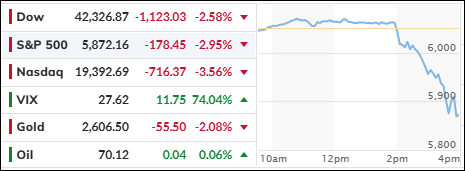
The Fed’s announcement of a 0.25% rate cut, which was expected to please the markets, had the opposite effect.
Fed Chair Powell’s comments about moving cautiously and seeking progress on inflation contradicted market trends, as inflation has been rising alongside strong economic data since the rate-cut cycle began. Powell’s belief that inflation is transitory or that disinflation is occurring seems to be at odds with market realities.
Traders reacted negatively to the Fed’s hawkish statement, causing rate cut expectations for 2025 to plummet and leading to a market-wide collapse.
Bond yields surged, with the 10-year yield reclaiming its 4.50% level, while the dollar was the only asset class to benefit, rising to its highest level since September 2022.
Our Trend Tracking Indexes (TTIs) also declined but remain above their respective trend lines for now. If this trend reversal continues, we may soon enter “Sell” mode and move back into the safety of our money market accounts.
This morning, the major indexes declined, with the Dow Jones Industrial Average marking its first 9-day losing streak since 1978. This streak began after the index surpassed the 45,000 level for the first time earlier this month.
Traders attribute these losses to a rotation from “old” economy stocks to the new technology sector. However, Nvidia, which was recently added to the Dow, also struggled, dipping into correction territory yesterday and losing an additional 1.2% today.
Conversely, Broadcom has emerged as a new tech favorite, reaching new highs on Monday, while Alphabet, Apple, and Tesla also hit record levels.
Today’s market pullback was anticipated ahead of the Federal Reserve’s decision on interest rates. Wall Street remains concerned that the Fed might make a policy error, potentially leading to a market blow-off top or accelerating inflation.
The US macroeconomic data index suffered another blow today, with negative reports on core retail sales, industrial production, and capacity utilization affecting the market and driving away bullish investors.
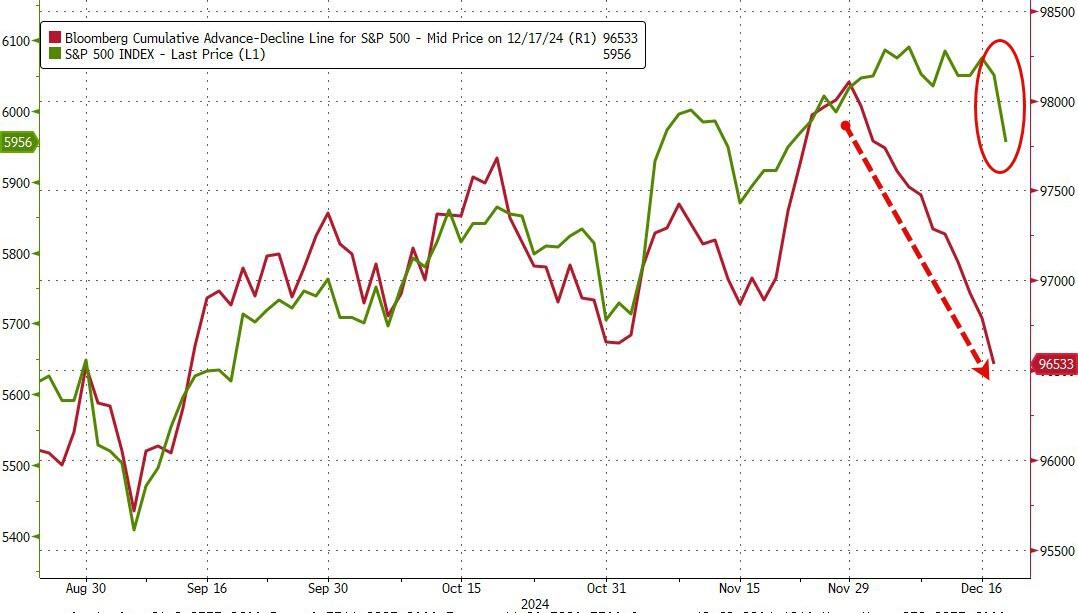
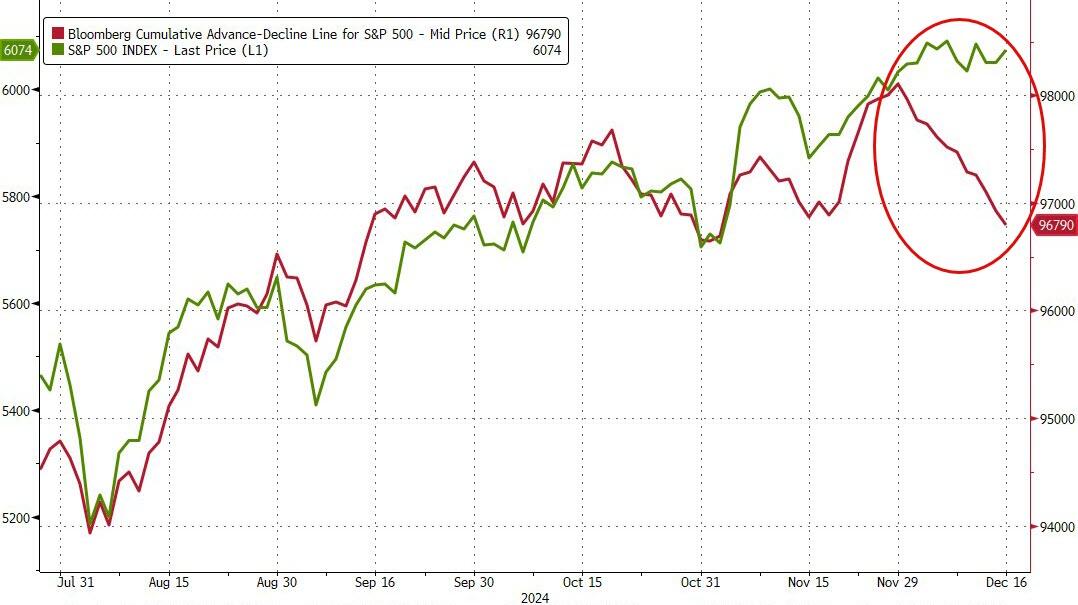
The major indexes retreated further, with the breadth indicator worsening for the 12th consecutive day, marking the second-longest stretch of weakness in 100 years. This indicates that market advances are being driven by only a few stocks, with the majority not participating.
While Nvidia nears a 13% drawdown from its highs, Bitcoin is testing new record levels. Bond yields reversed yesterday’s rally, the dollar remained in a tight range, and gold dipped below its 50-day moving average.
Will tomorrow’s Fed decision on interest rates lift the equity markets out of their current slump?

