
- Moving the market
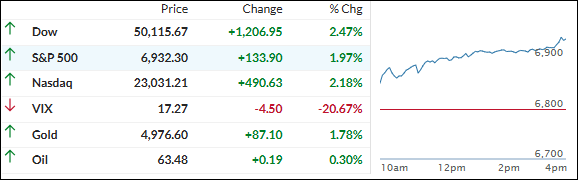
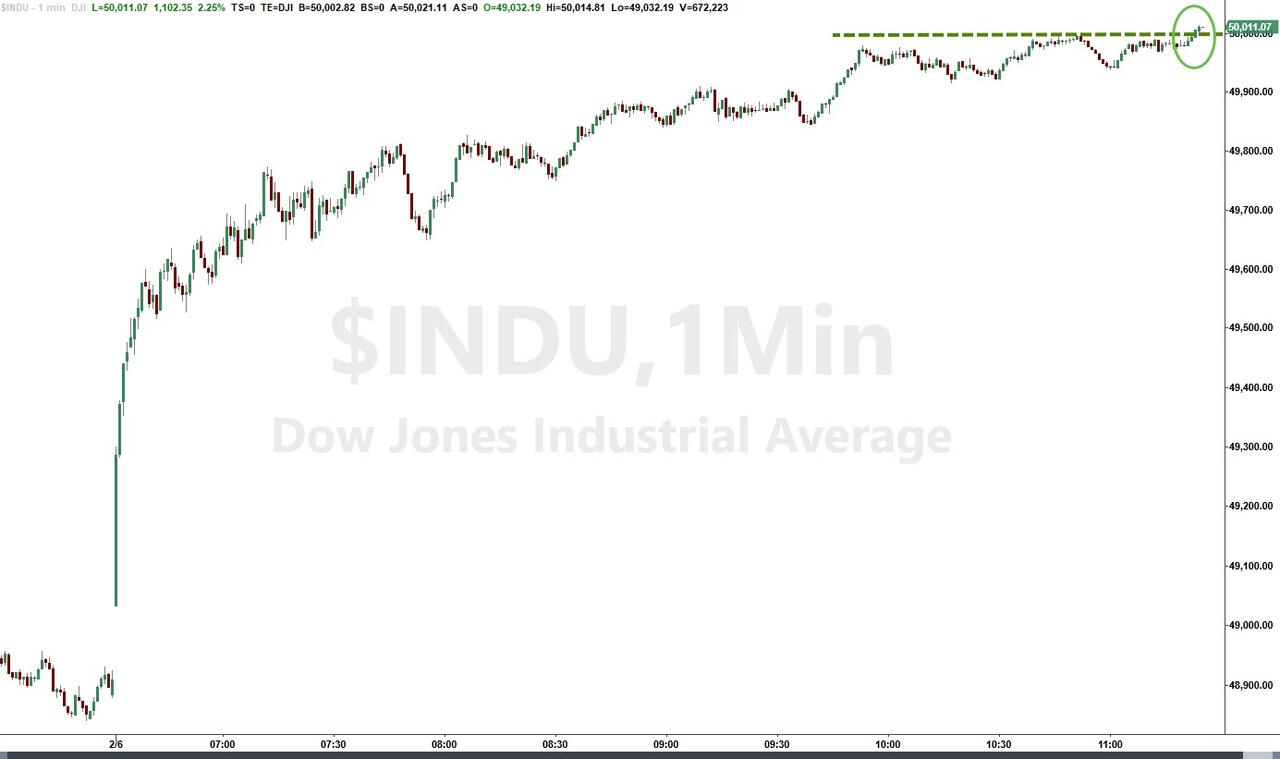
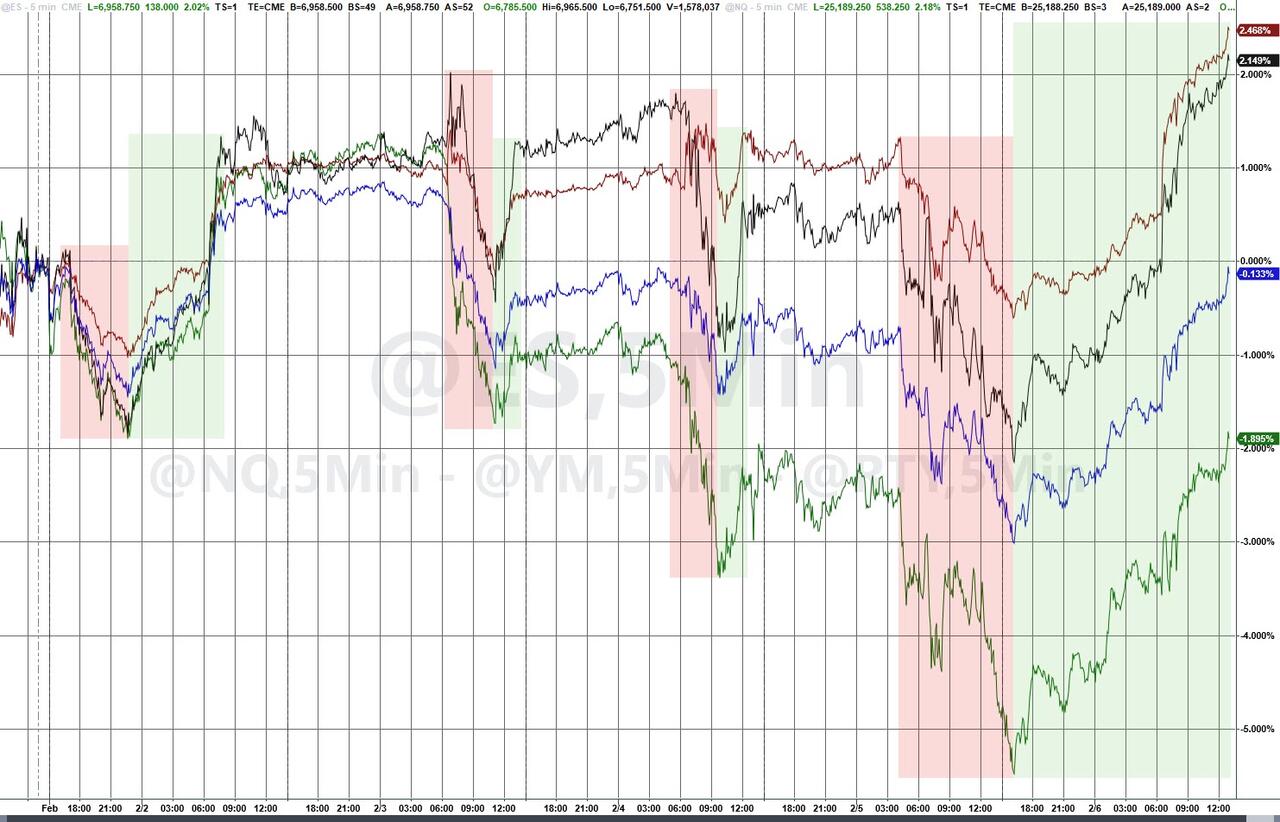
The major indexes opened with a nice pop after the January nonfarm payrolls report came in way stronger than expected: +130,000 jobs added vs. economists’ call for just +55,000.
That was also a big step up from December’s downwardly revised +48,000. It marked the best monthly gain in over a year, though the growth was heavily concentrated in health care (which added 124,000 positions—double its usual pace).
That said, there’s still the ongoing pattern of downward revisions throughout 2025 (average monthly job growth for the year was only +15,000 after all adjustments), so some traders are calling today’s number a potential outlier.
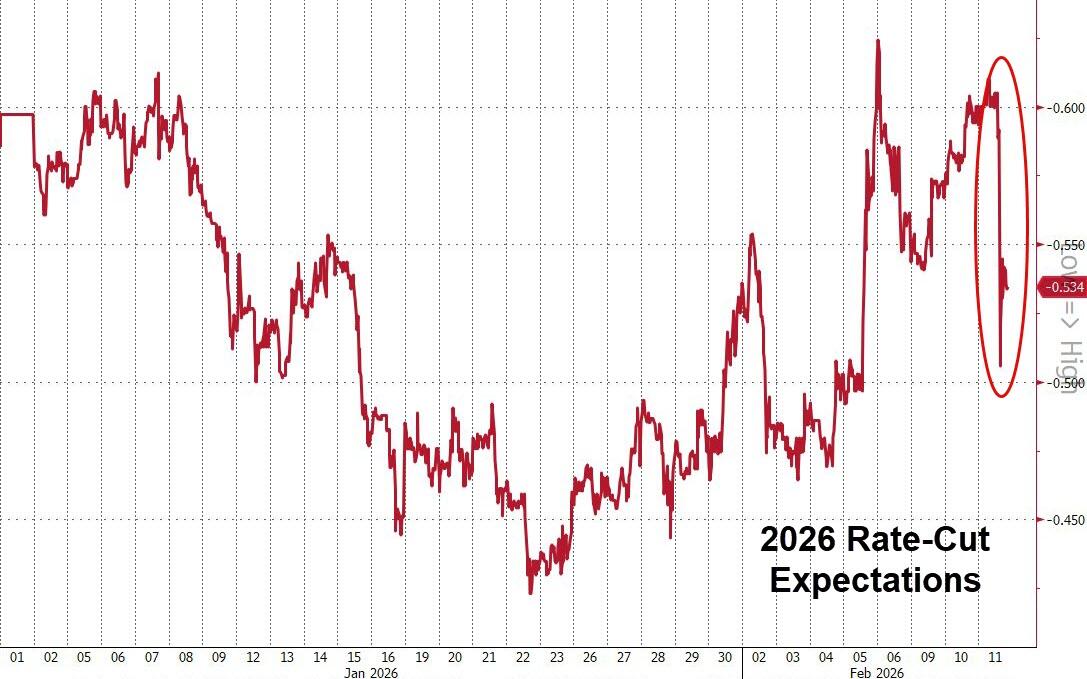
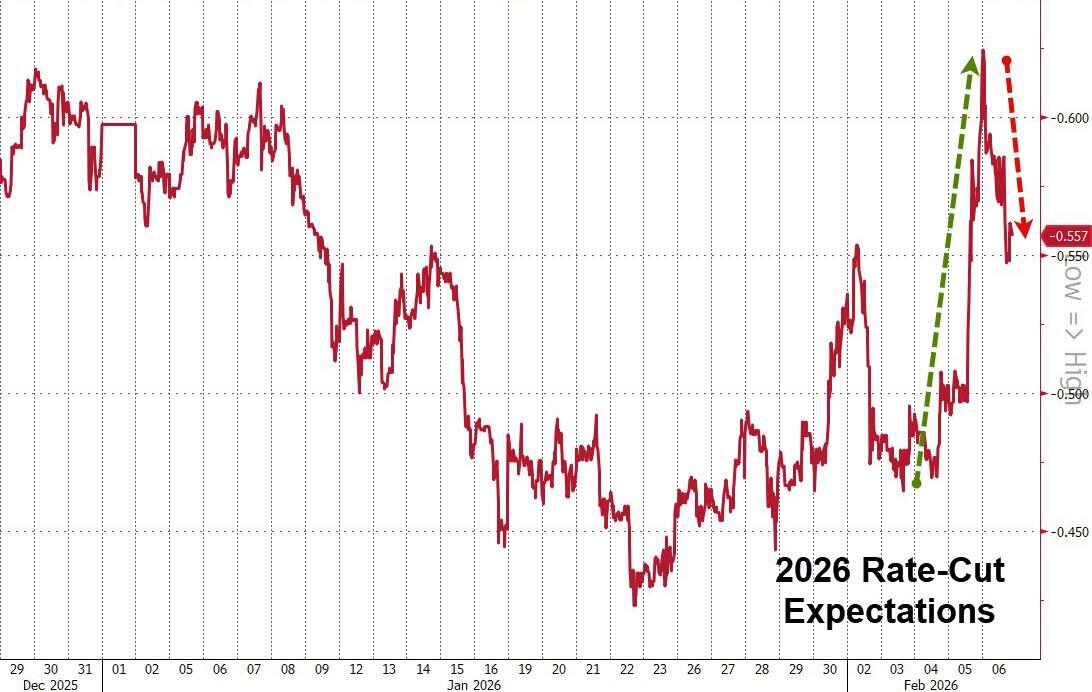
Rate-cut expectations dropped sharply on the back of the strong print.
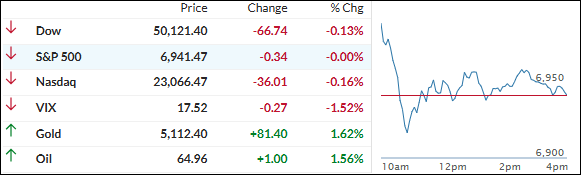
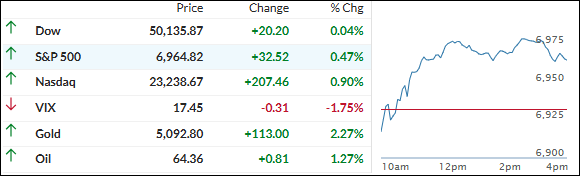
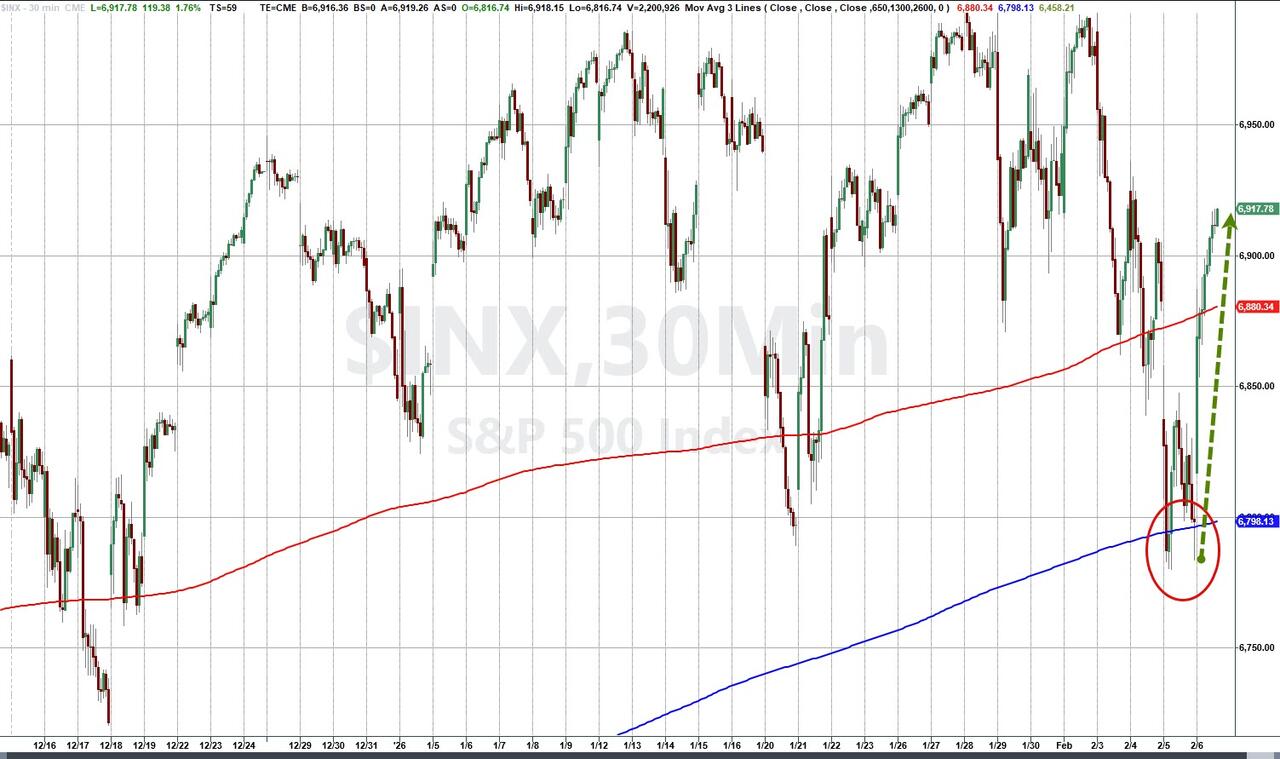
Early enthusiasm faded fast—the indexes dove into the red mid-session, tried to claw back, but ultimately closed basically flat.
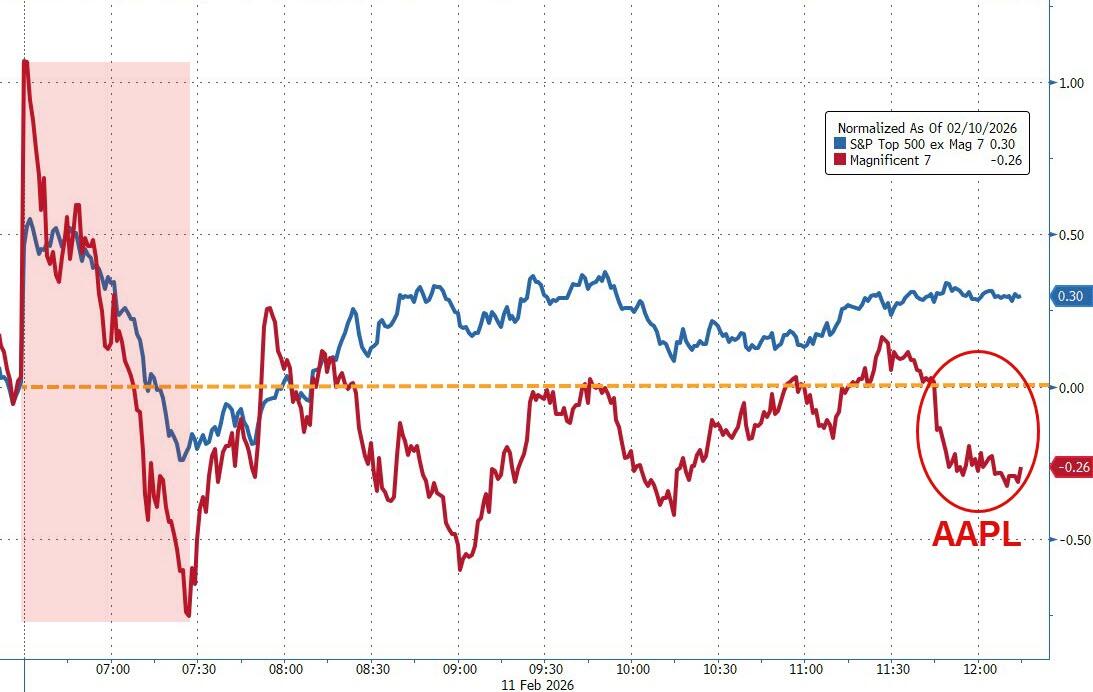
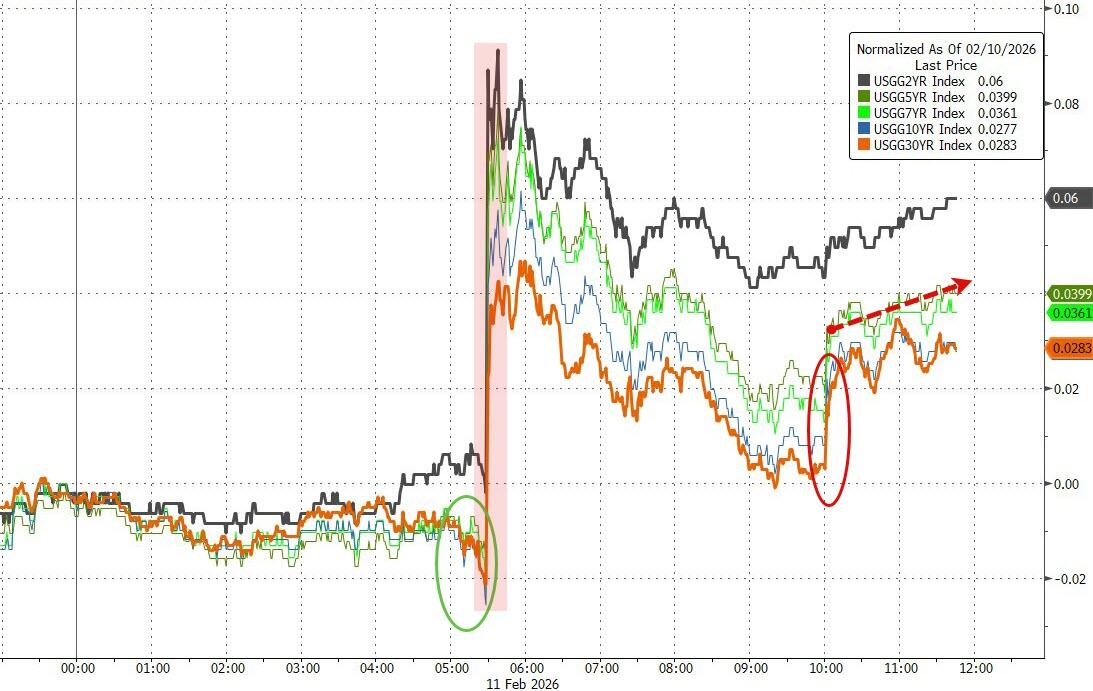
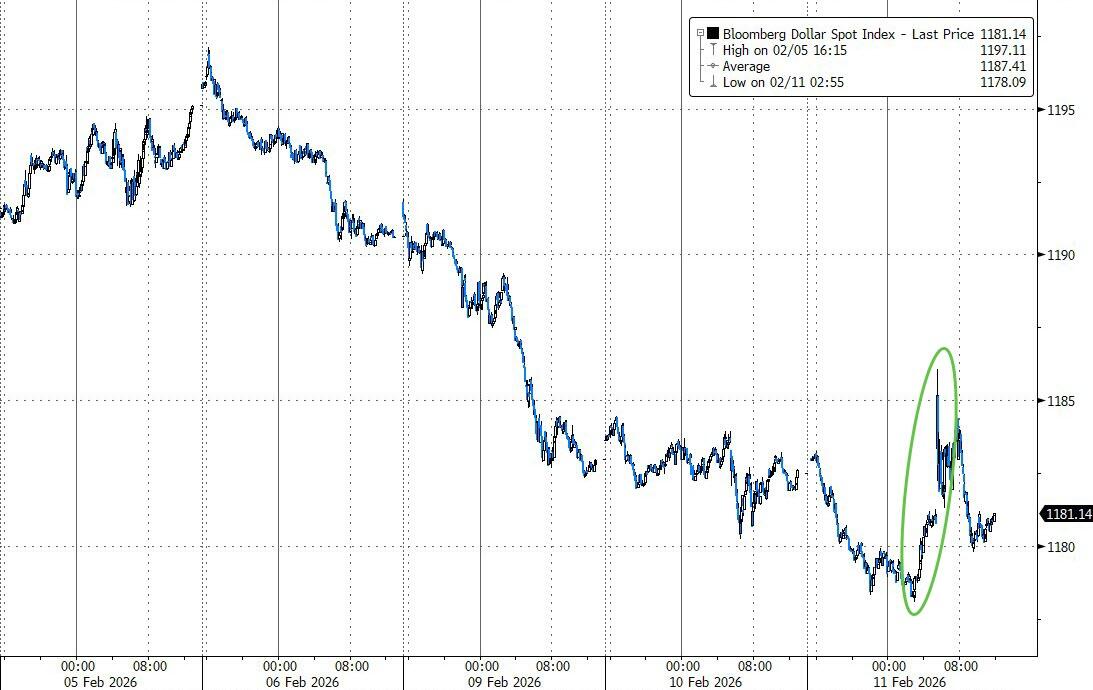
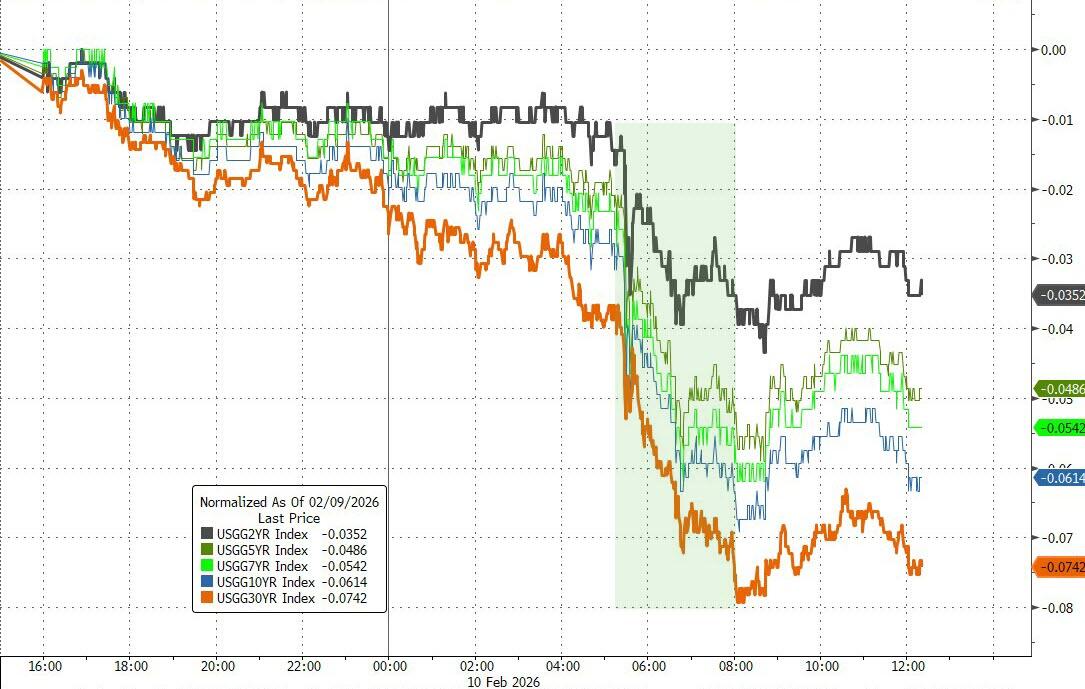
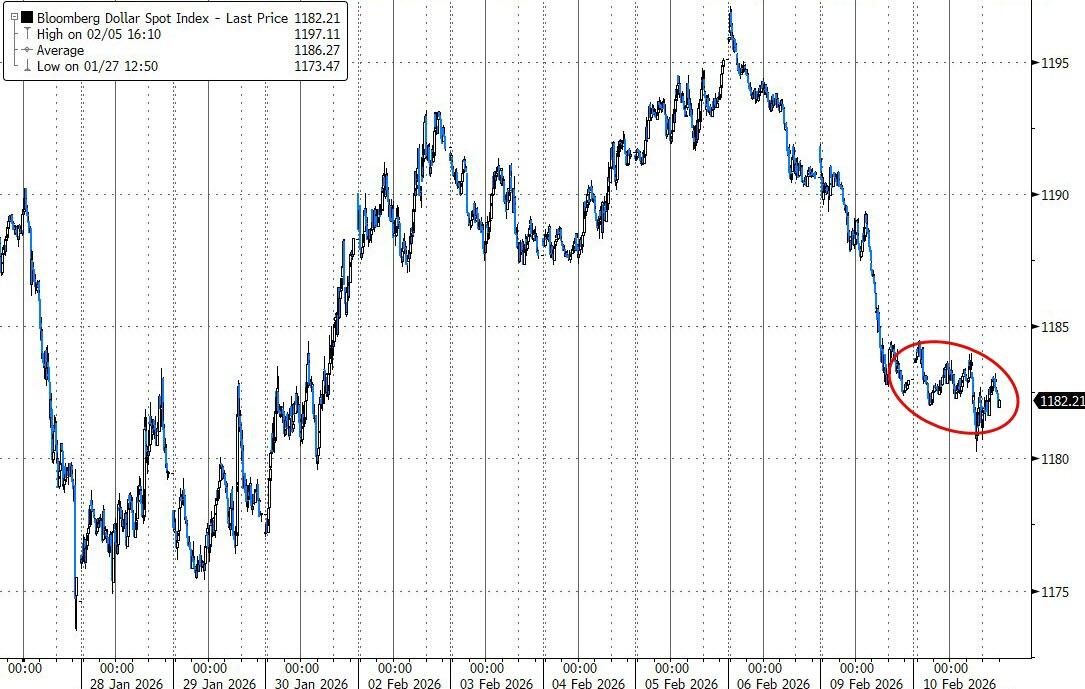
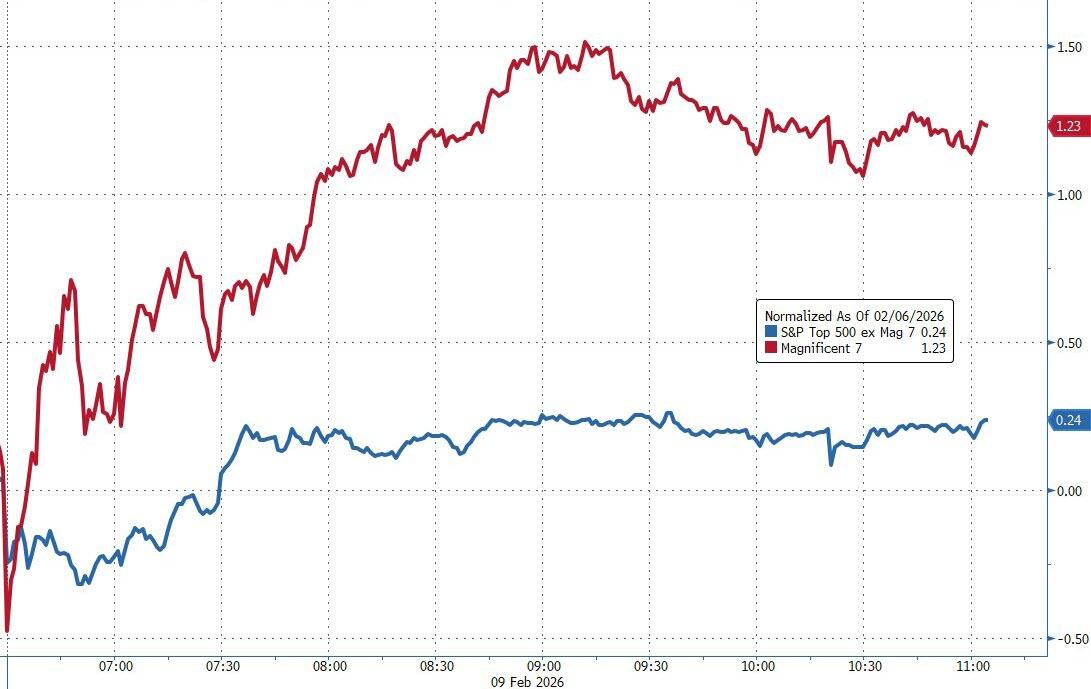
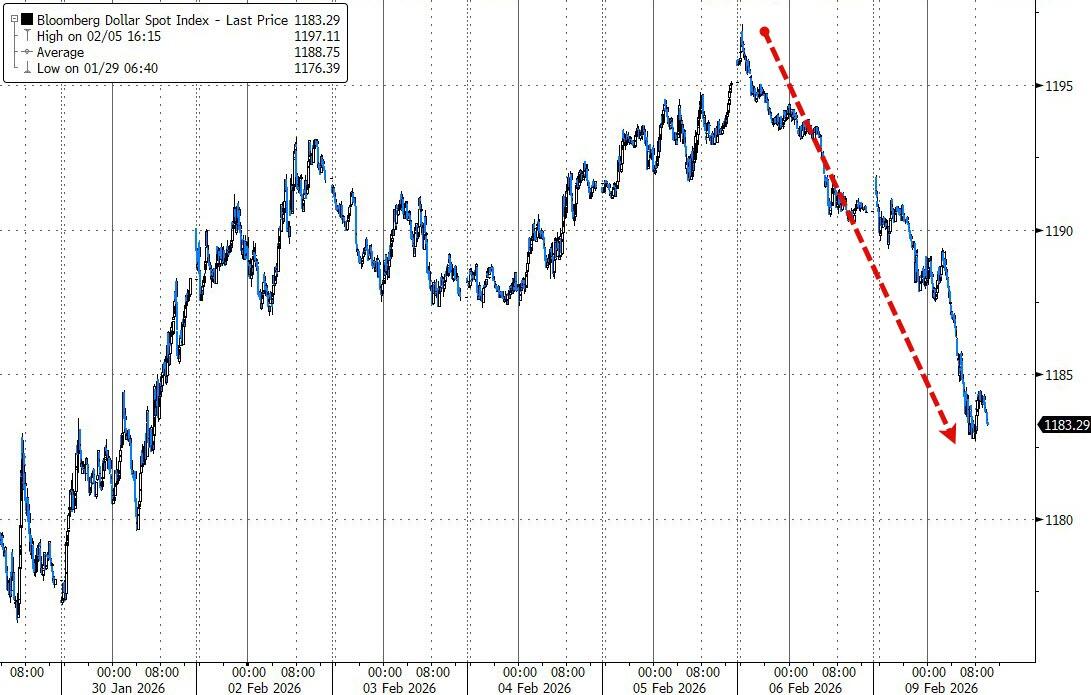
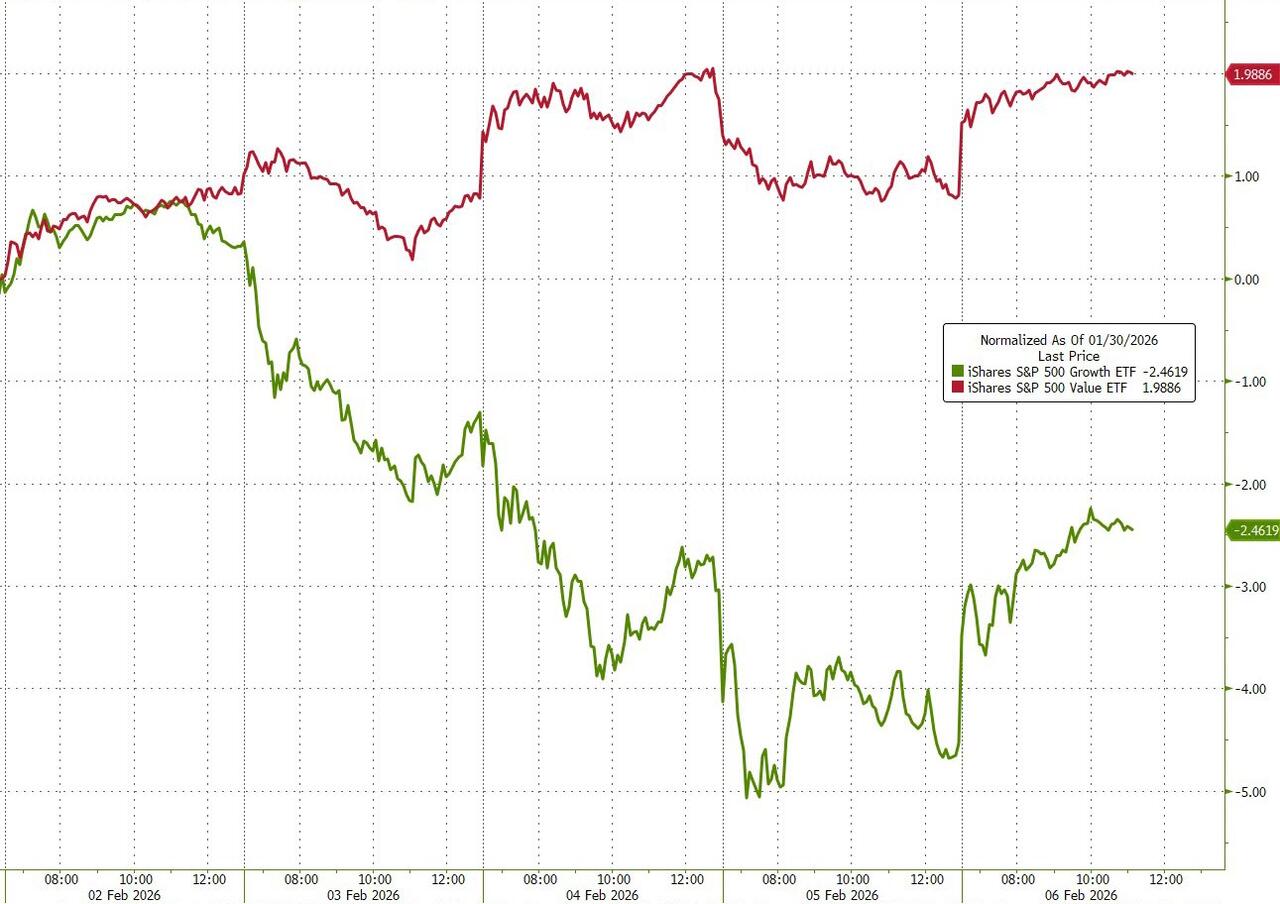
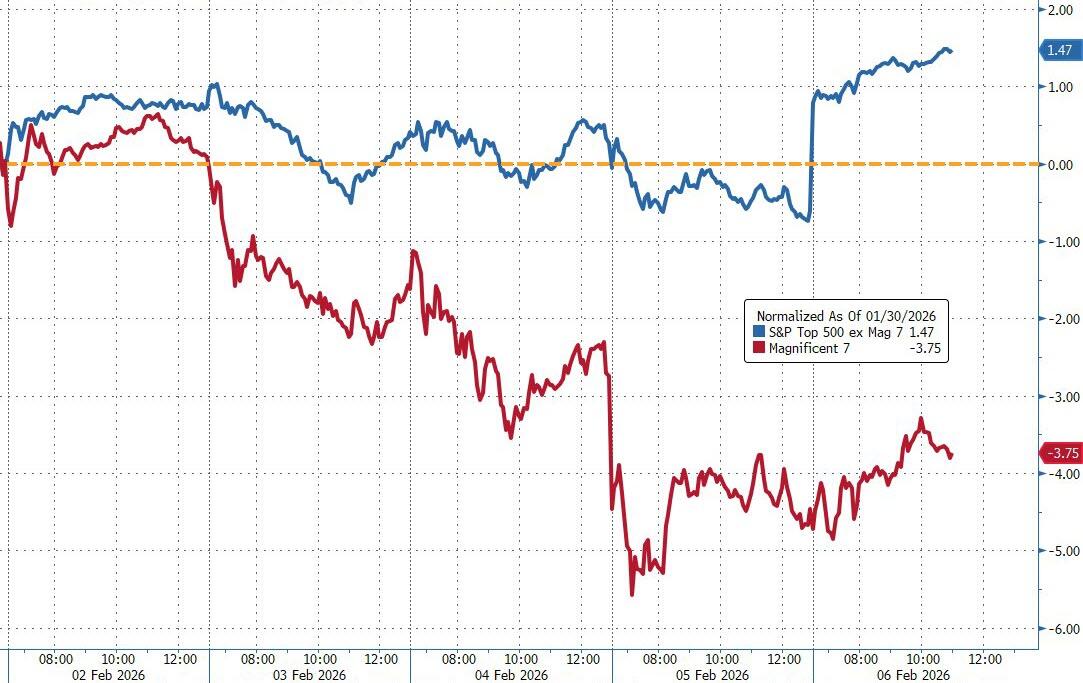
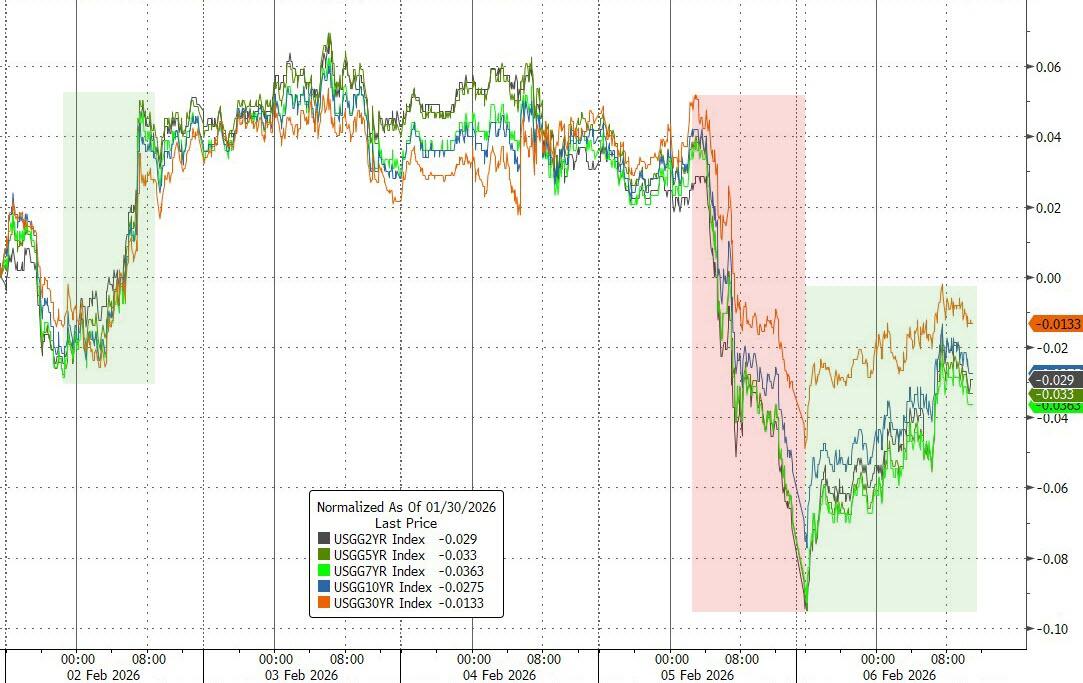
The Mag 7 underperformed the rest of the S&P 493 again, bond yields rallied higher, and the dollar slipped for the fourth straight day.
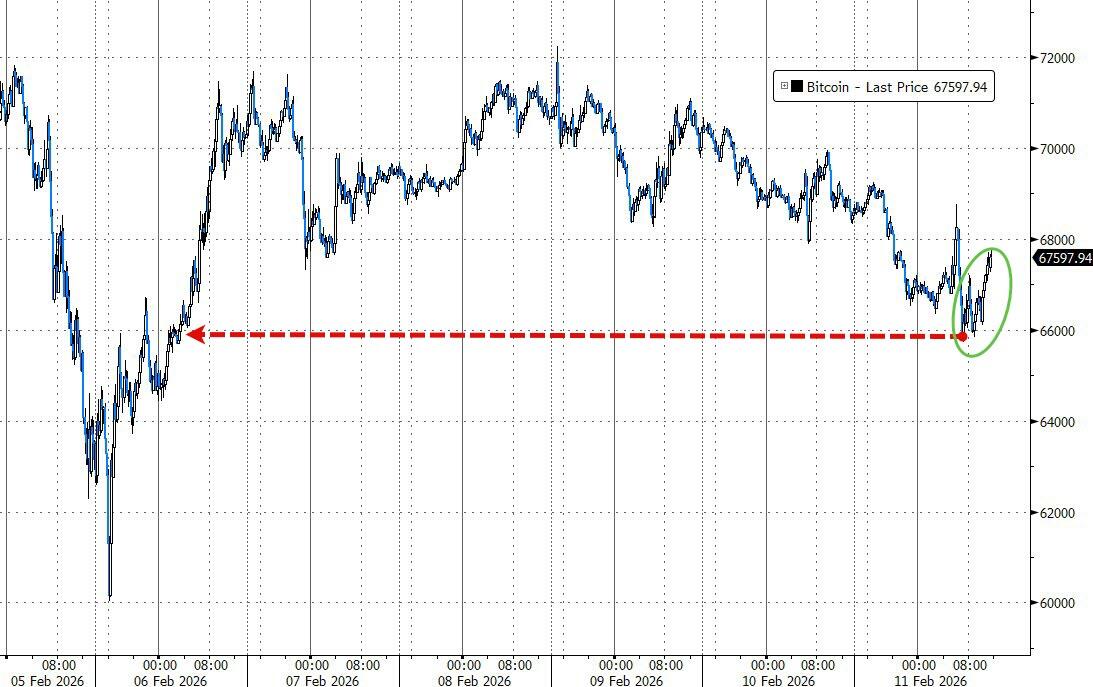
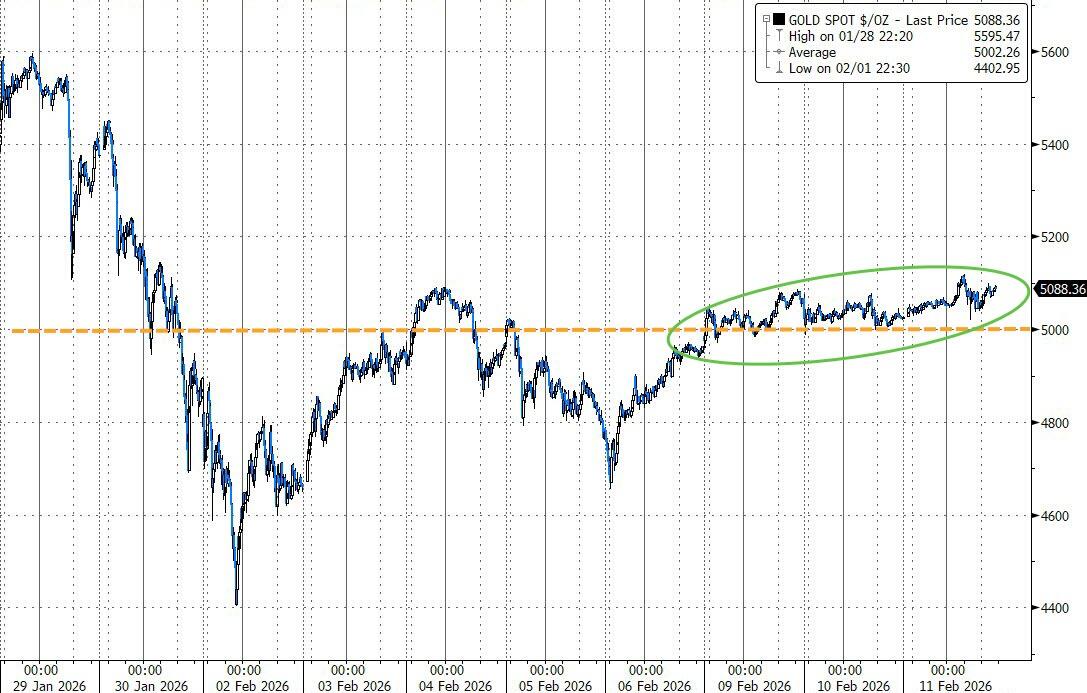
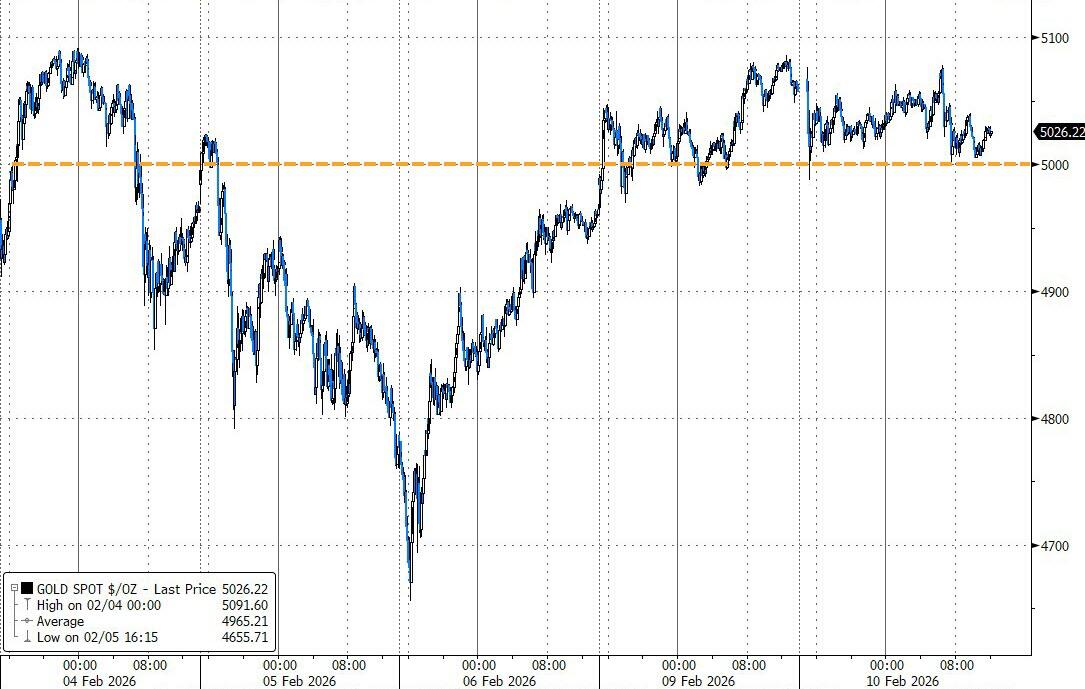
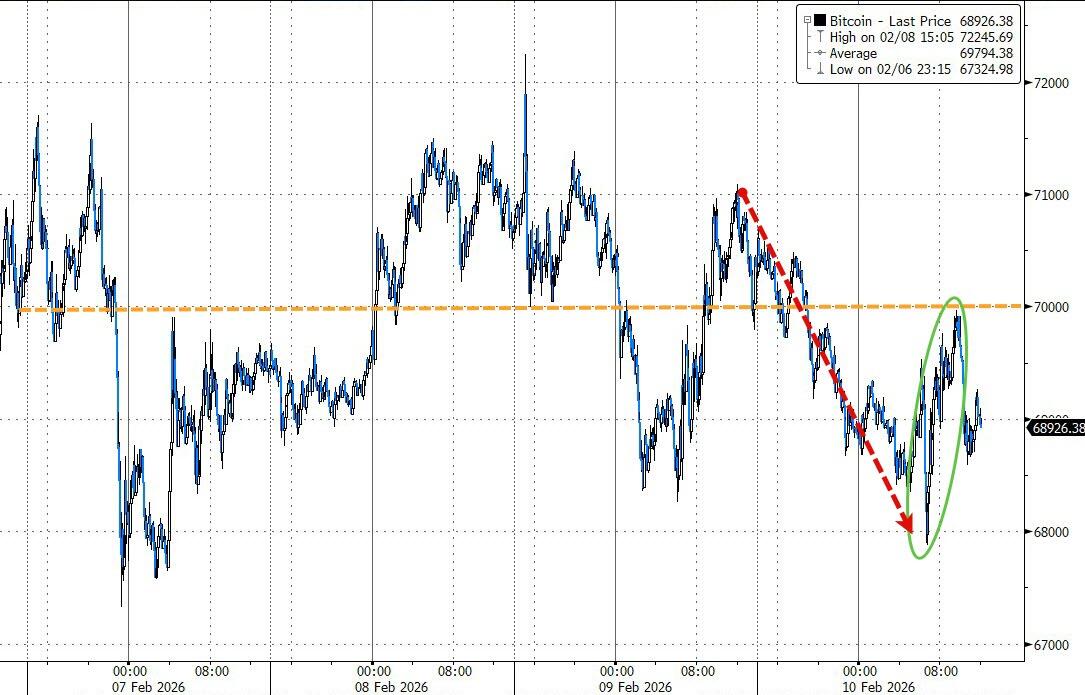
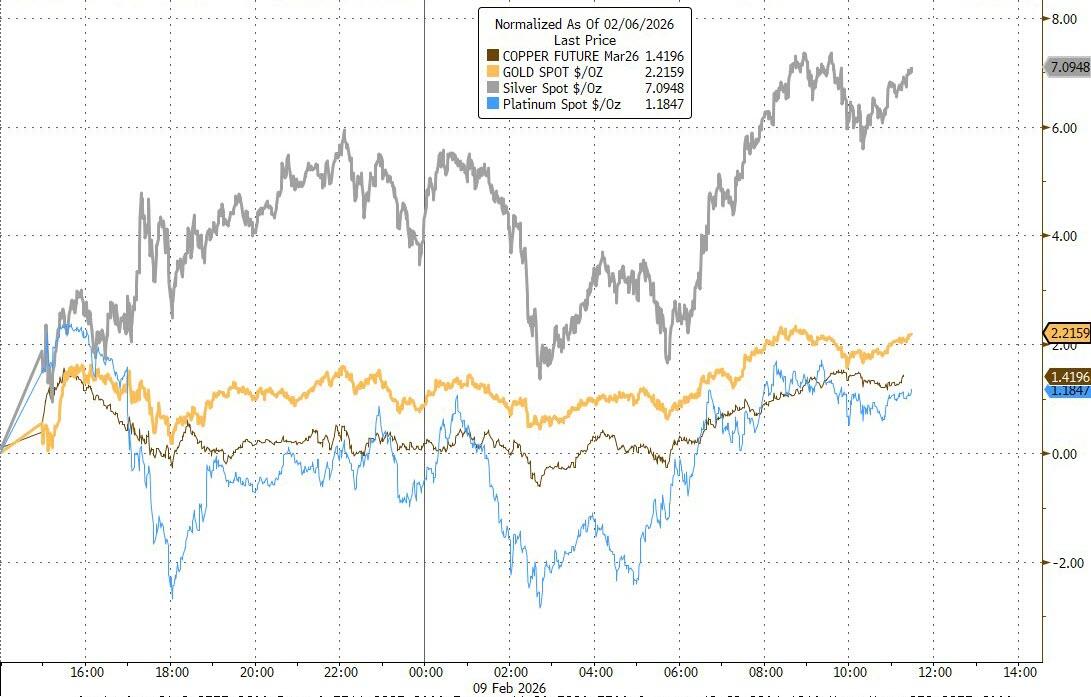
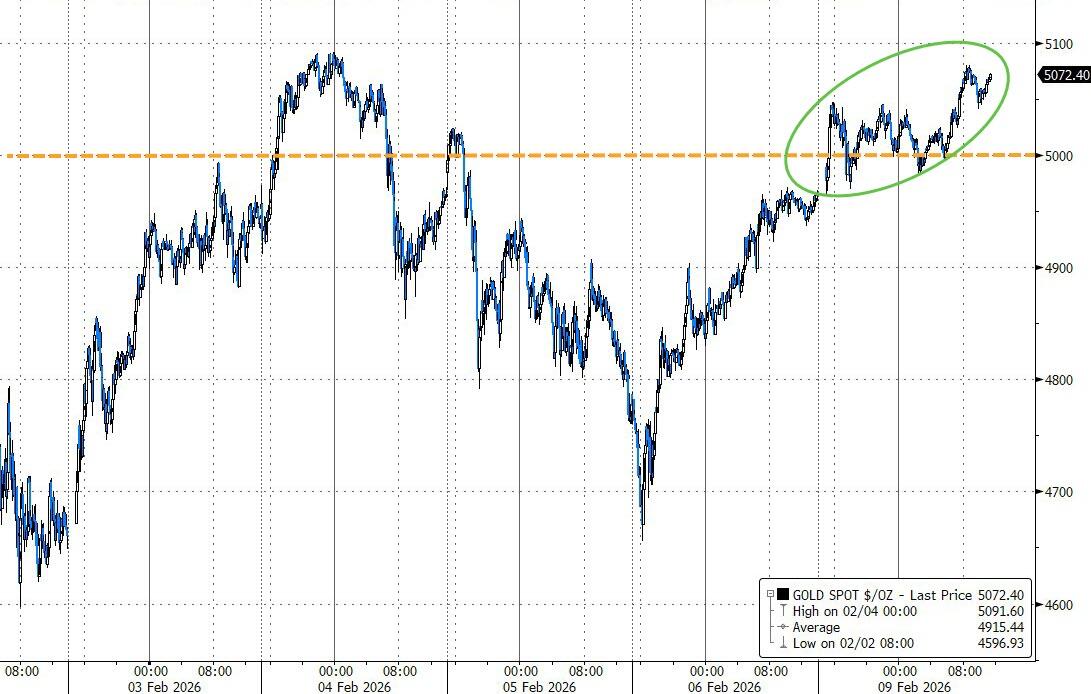
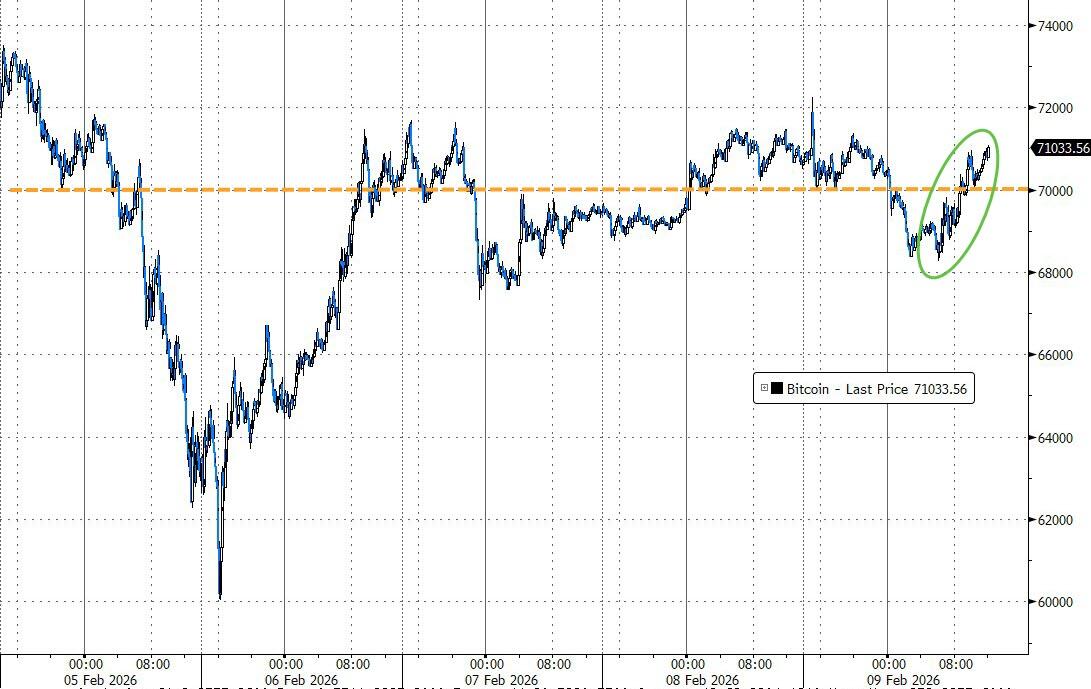
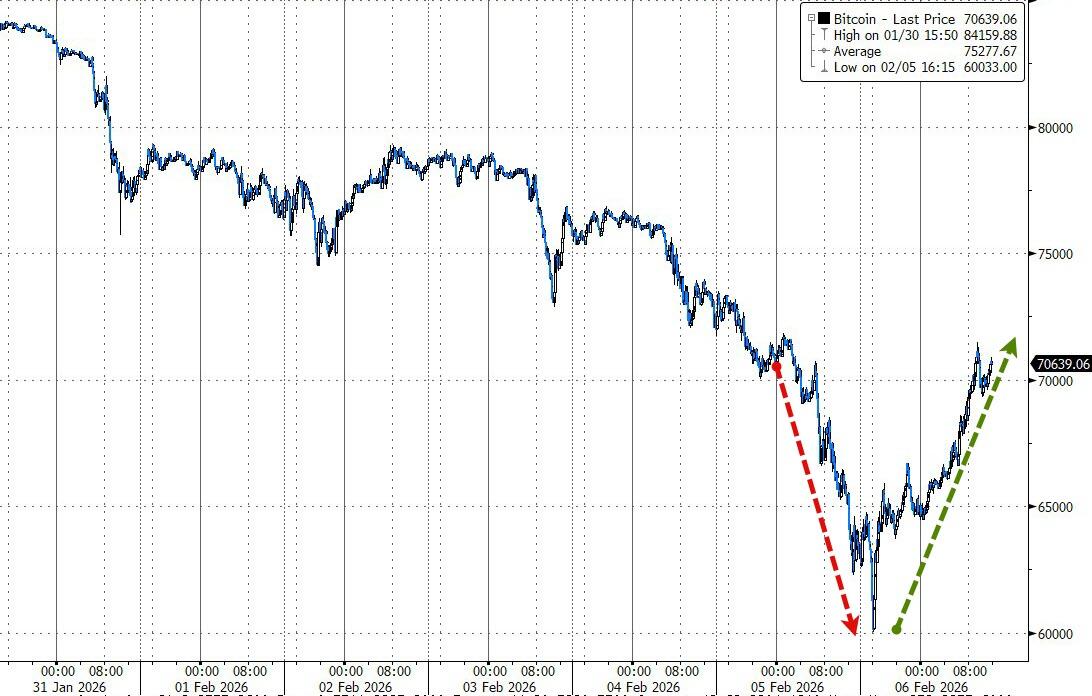
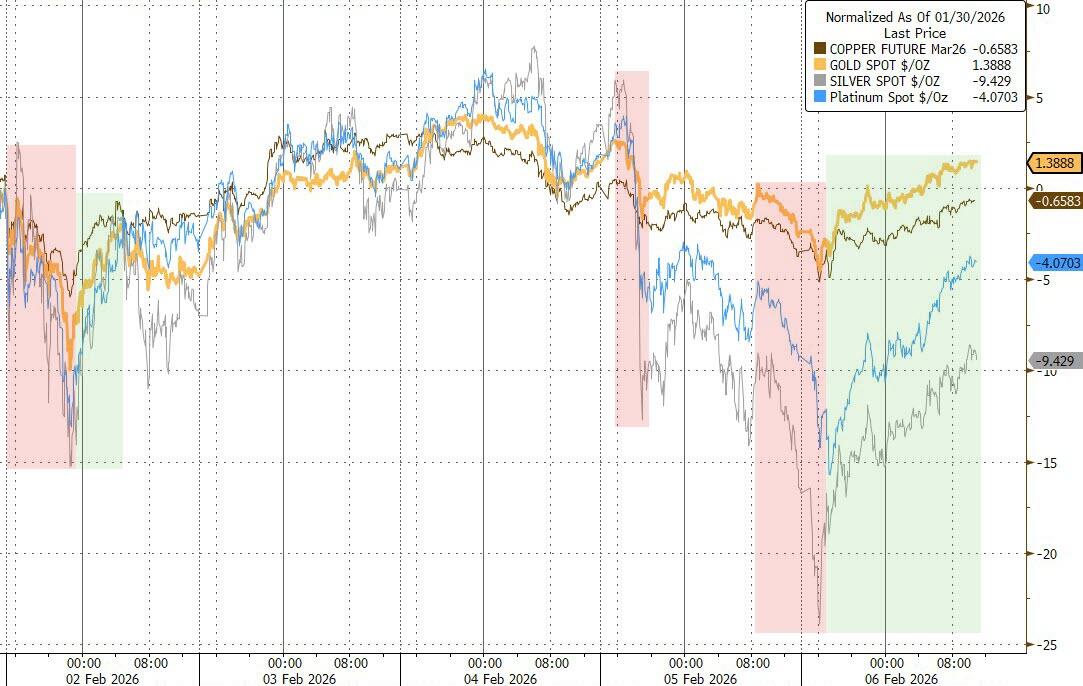
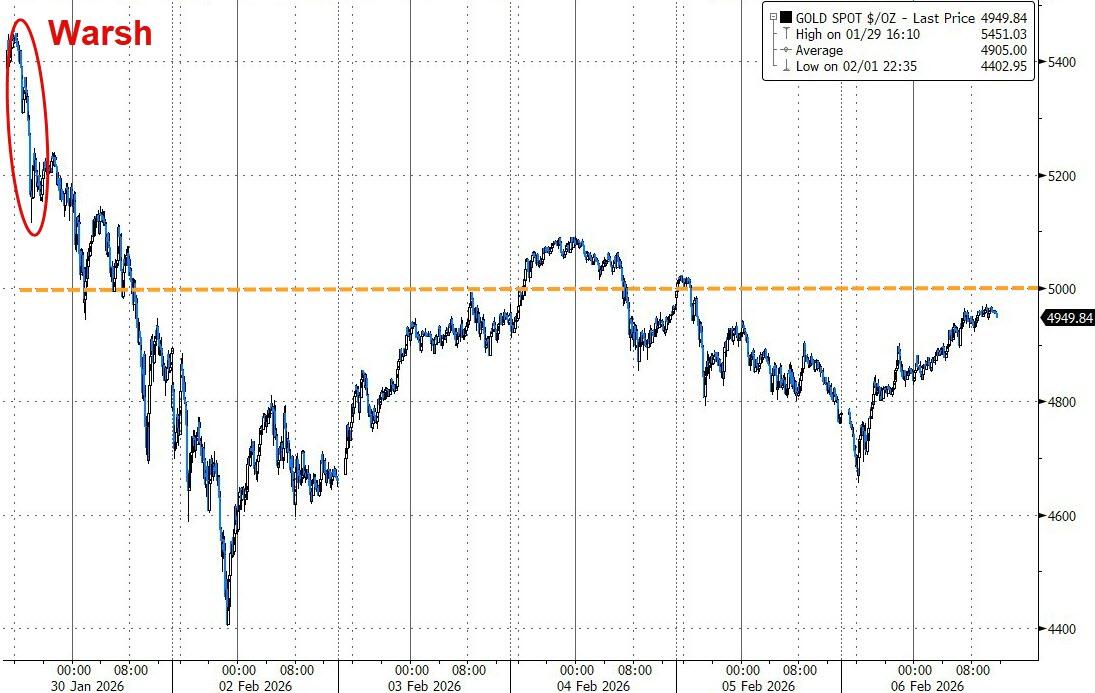
Bitcoin dipped but bounced off the $65K level. The metals provided the real lift: gold held firm above $5,100, and silver jumped over 4%, giving our portfolios a nice cushion despite the equity drag.
It’s a great example of how commodities can act as solid insurance when stocks go sideways.
Read More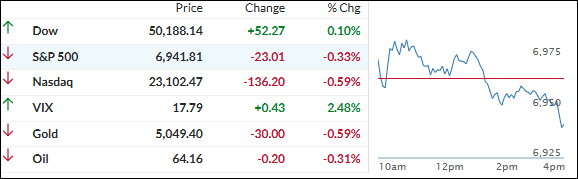
