Do you want to know which ETFs are hot and which ones are not? Then you need my High-Volume ETF Cutline report. It tells you how close or far each of the 311 ETFs I follow is from its long-term trend line (39-week SMA). These are the ETFs that trade more than $5 million a day, so they are not some obscure funds that nobody cares about.
The report is split into two parts: The winners that are above their trend line (%M/A), and the losers that are below it. The yellow line is the line of shame that separates them. You can see how many ETFs are in each group and how they have changed since the last report (180 vs. 178 current).
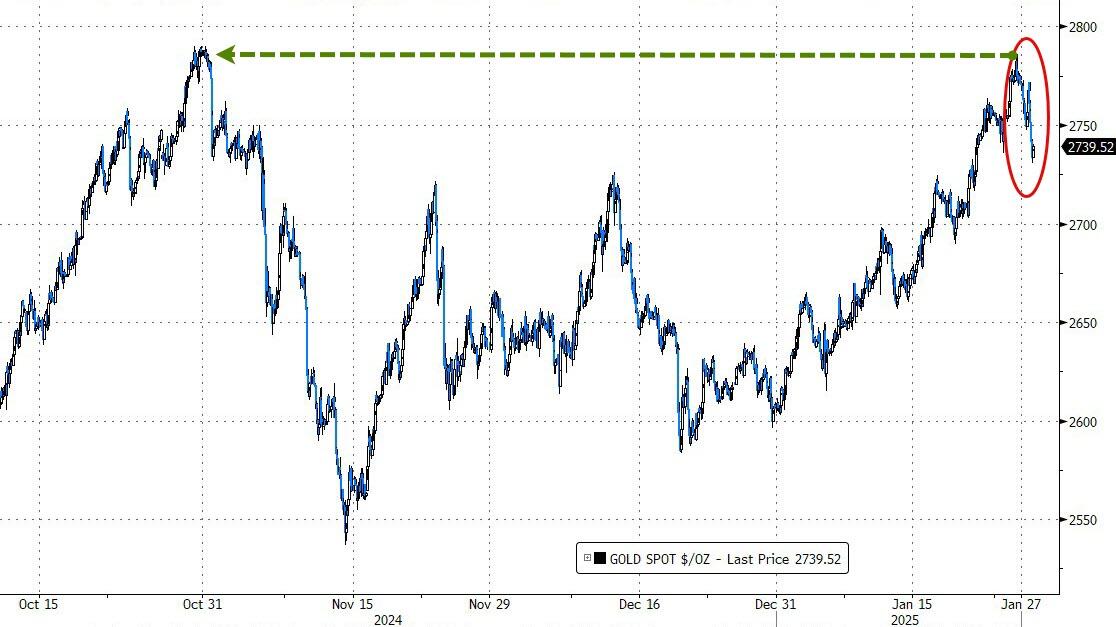
GOLD HITS RECORD HIGHS AS MARKETS REACT TO TARIFFS AND INFLATION
[Chart courtesy of MarketWatch.com]
Moving the market
Despite Apple releasing a mixed earnings report, bullish sentiment persisted through mid-session on the last trading day of the month.
However, investor confidence waned later in the day as bond yields spiked and President Trump’s tariffs on Canadian and Mexican goods were set to take effect the next day. This shift in sentiment caused the major indices to end the day in the red.
Apple exceeded first-quarter expectations but reported disappointing iPhone sales. Despite this, traders focused on the positive aspects, and the stock gained 1.6%. In contrast, Chevron and Exxon reported fourth-quarter results below expectations, leading to declines of 4.5% and 2.5%, respectively.
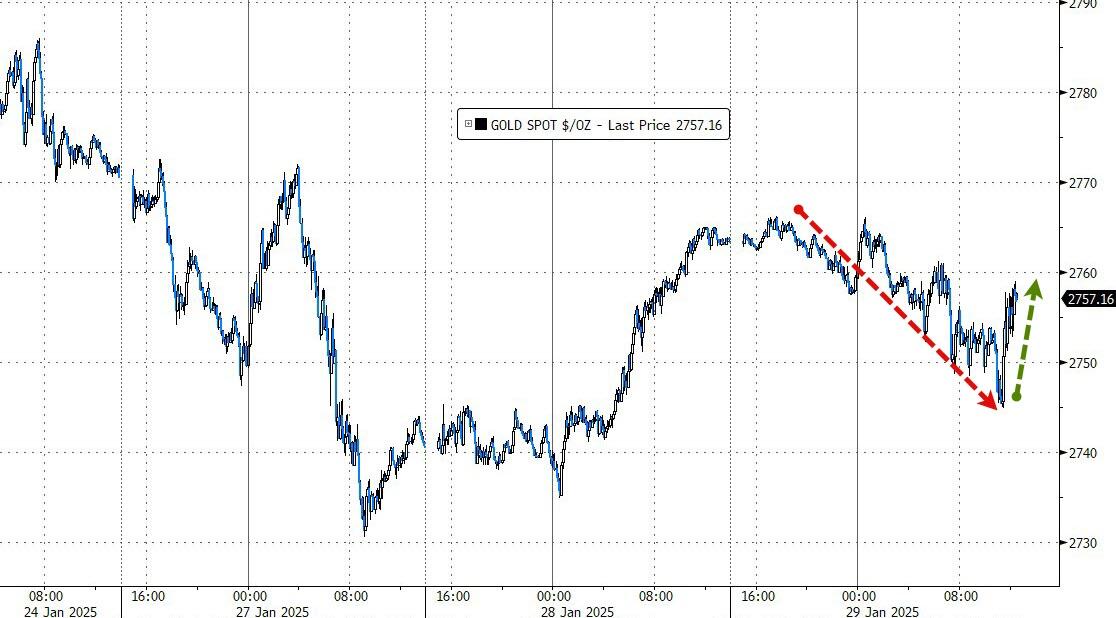
A key data point, the Personal Consumption Expenditure (PCE) price index, which is the Federal Reserve’s preferred inflation gauge, showed a 0.3% increase from November and a 2.6% annual rate. While this was in line with expectations, it highlighted the ongoing rise in inflation, accelerating from the previous month’s rate of 2.4%. Could this be why gold is reaching new all-time highs?
Despite a rocky month, the major indices managed to recover from various selloffs and posted solid gains. The Dow led with a 4.7% increase, followed by the S&P 500 at 2.7%, and the Nasdaq at 1.5%.
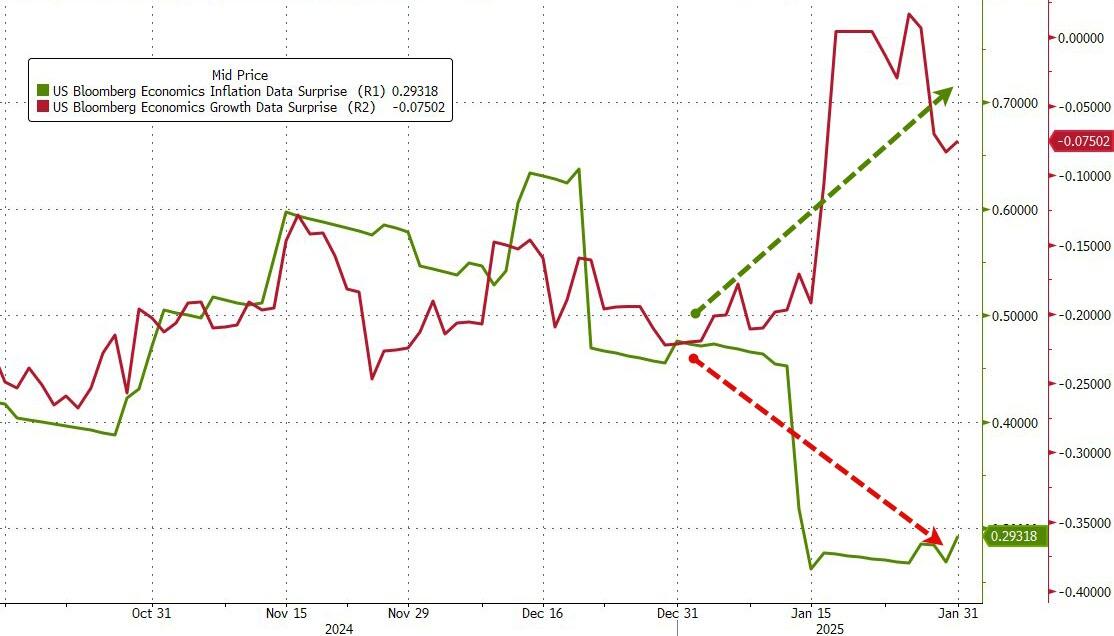
Traders viewed this month as a “goldilocks” period, with growth data exceeding expectations and inflation data being less severe than anticipated, reinforcing the belief that the economy is growing while inflation is slowing.
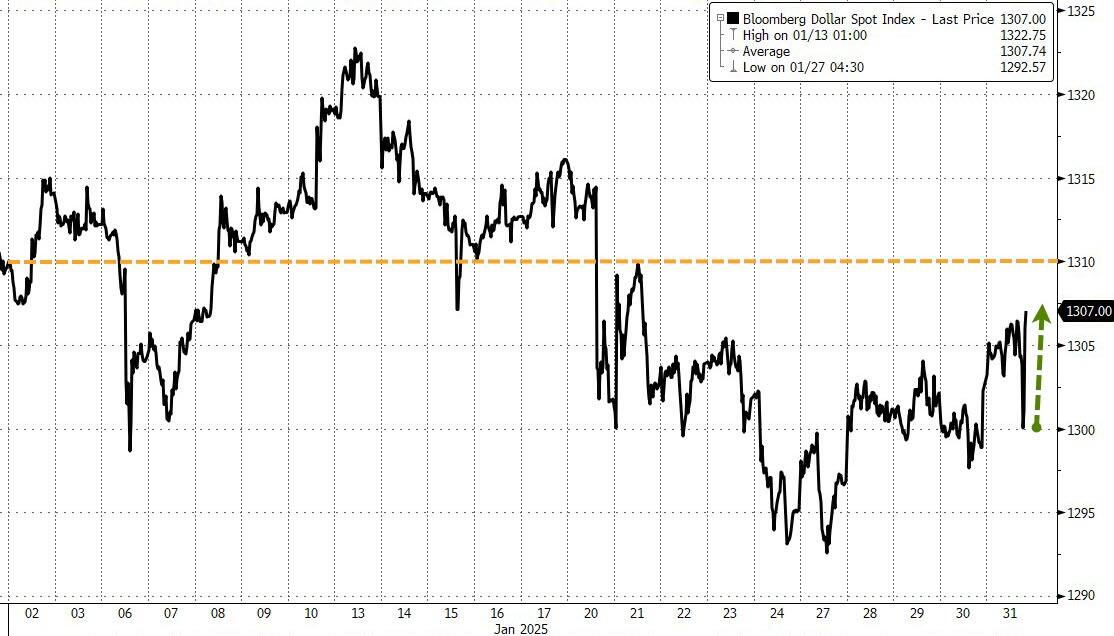
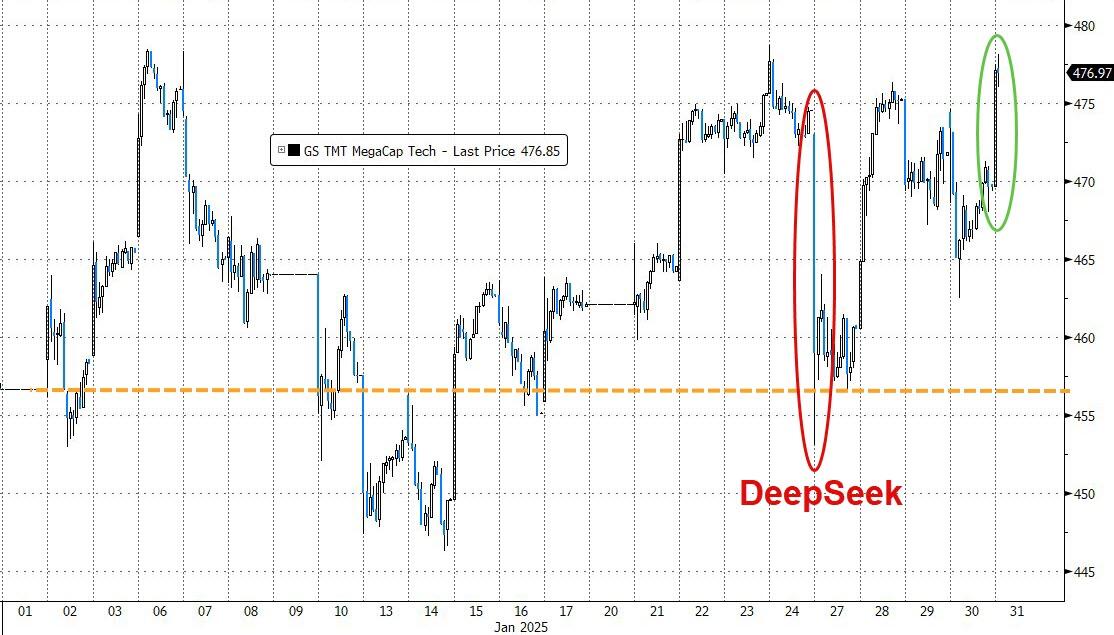
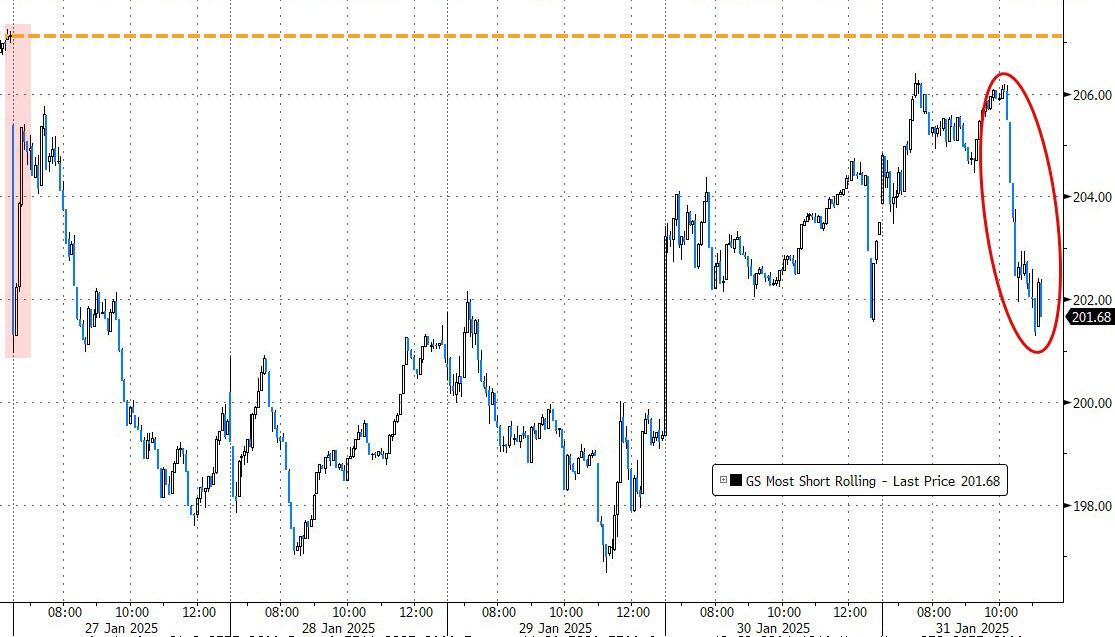
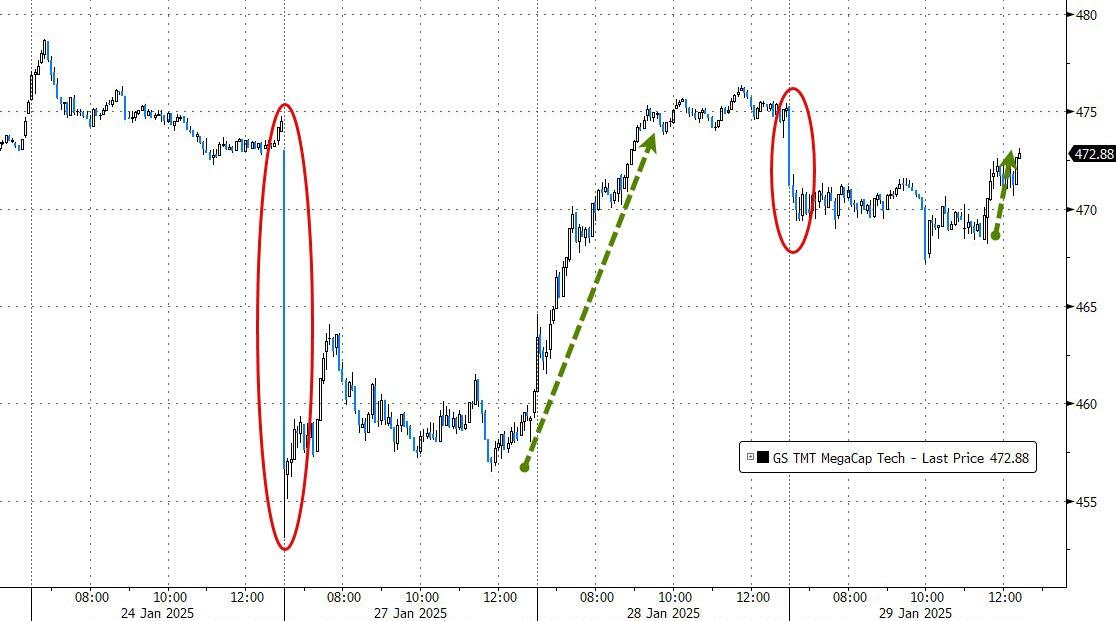
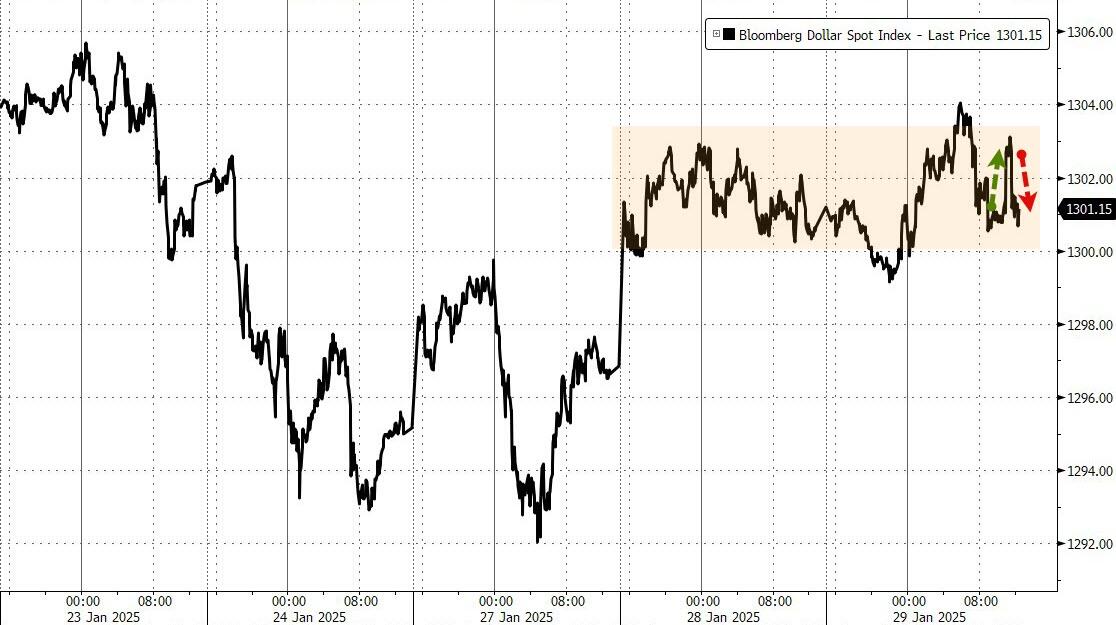
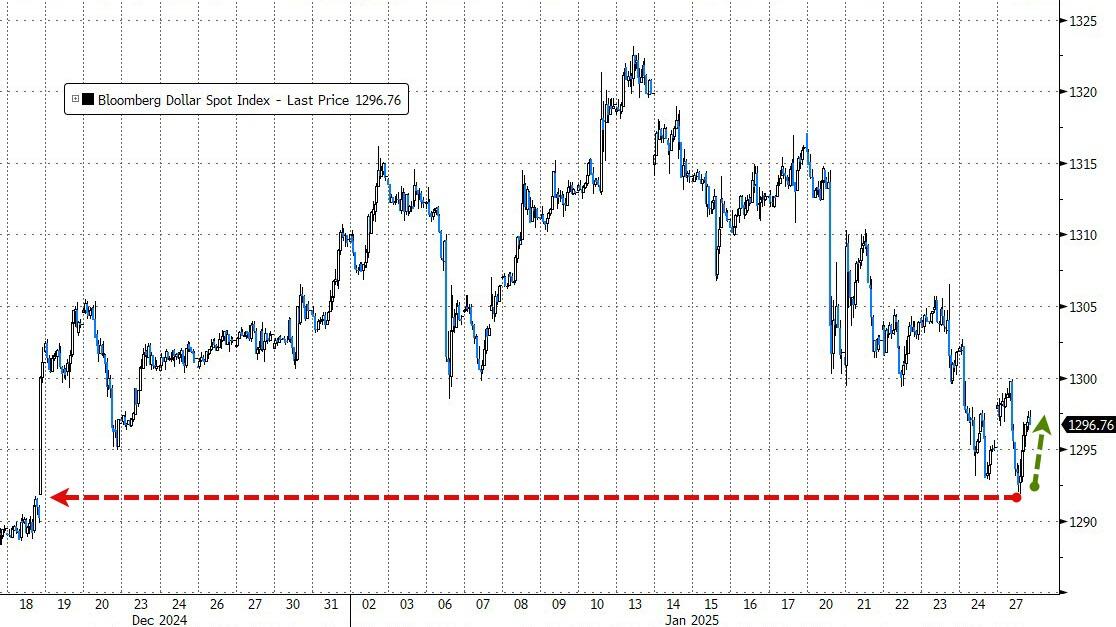
The US dollar ended the month lower despite today’s spike. Mega-cap tech stocks recovered from the “DeepSeek” scare, while the most shorted stocks were hit hard due to Trump’s tariff announcement.
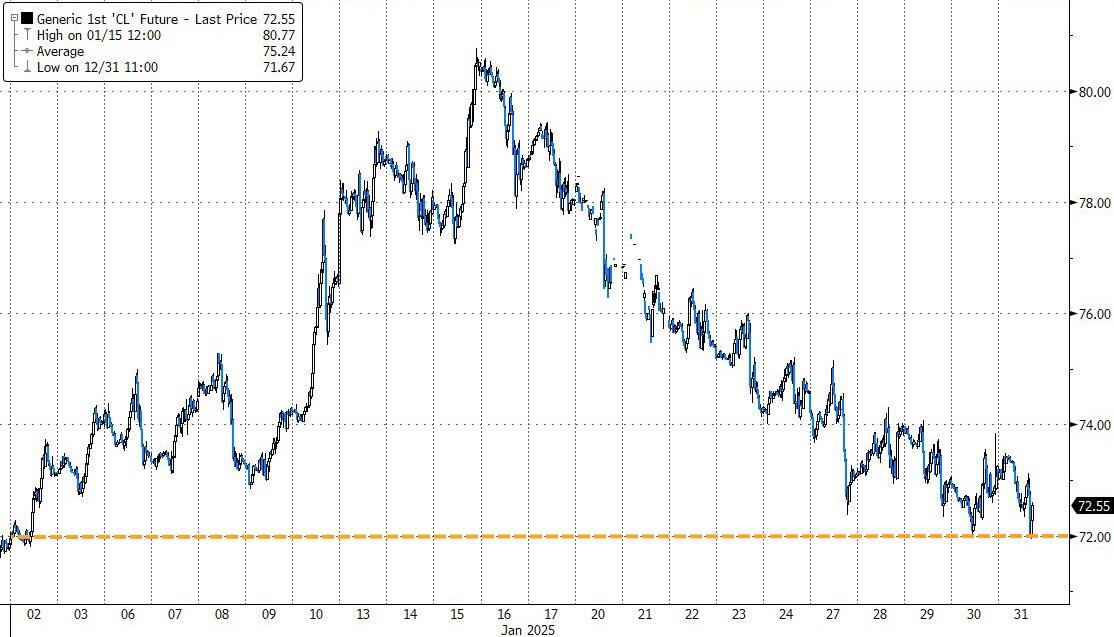
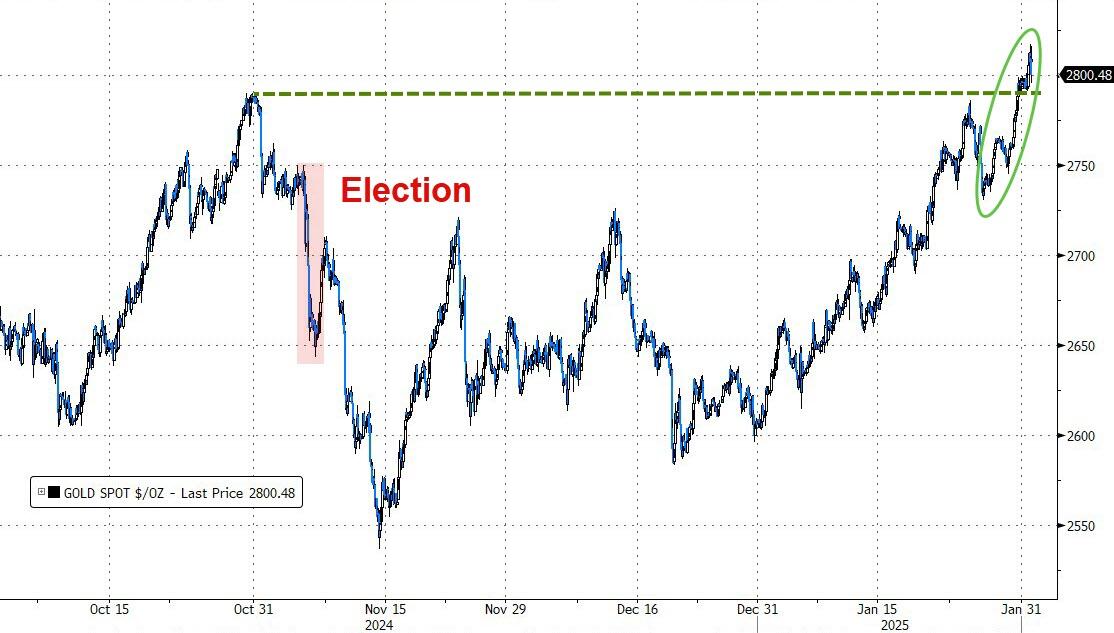
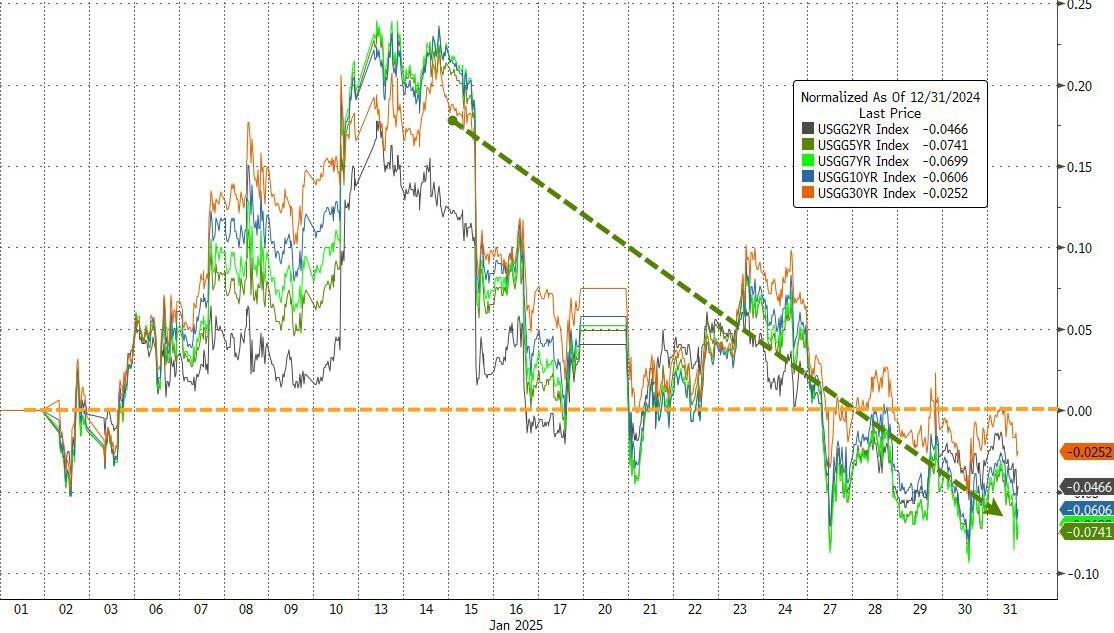
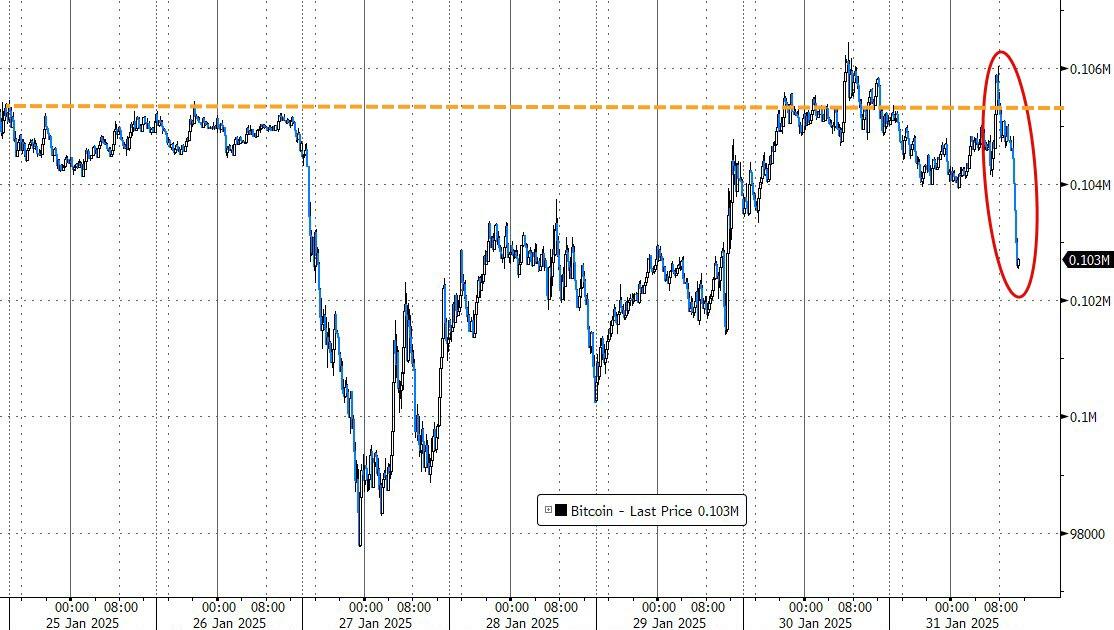
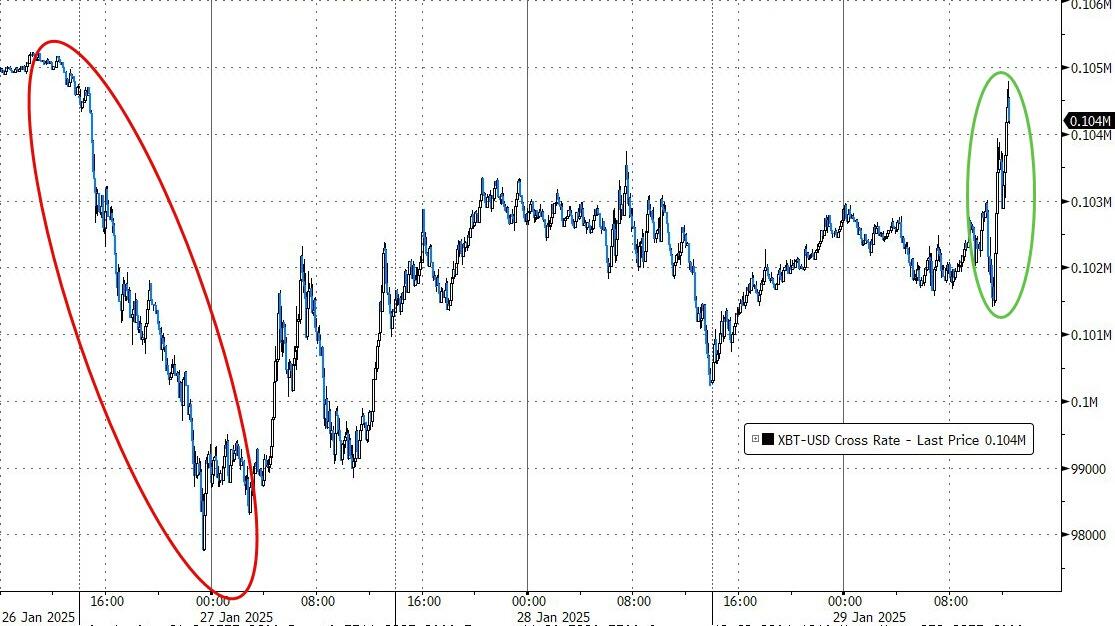
Oil prices remained unchanged for January, but gold rallied over 7%, marking its best start to a year since 2015 and reaching a record high of $2,800. Bond yields saw volatility, initially spiking before selling off and ending the month lower. Bitcoin also had a strong month, advancing nearly 9% and emerging as the top performer.
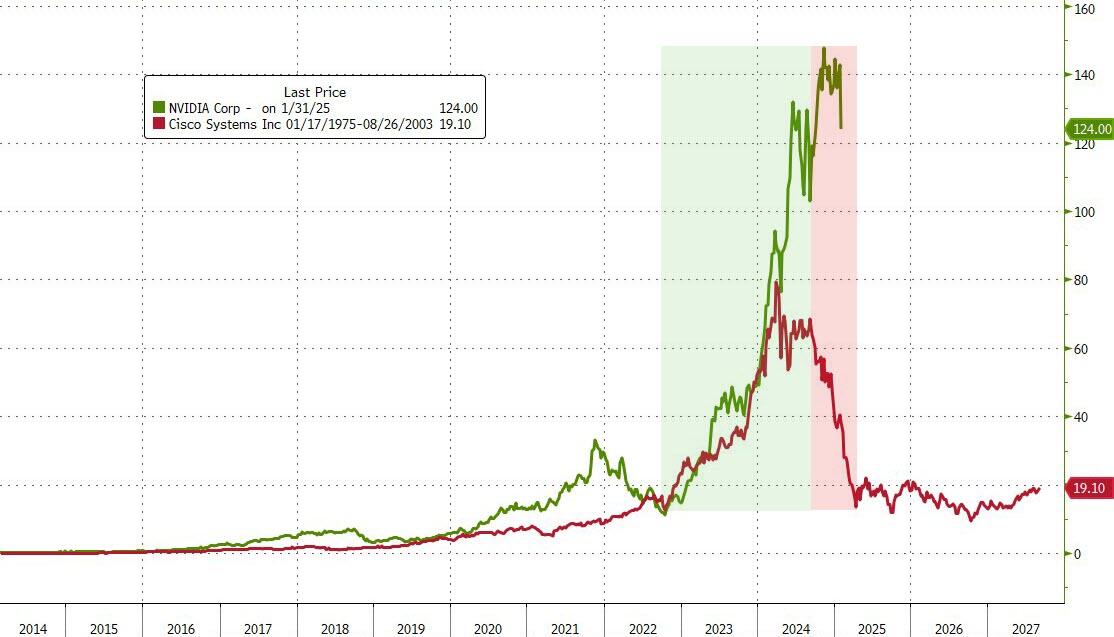
With Nvidia experiencing its biggest weekly loss of $450 billion since September 2022, ZeroHedge pointed to a historical analog, prompting the question:
ETF Data updated through Thursday, January 30, 2025
How to use this StatSheet:
Out of the 1,800+ ETFs out there, I only pick the ones that trade over $5 million per day (HV ETFs), so you don’t get stuck with a lemon that nobody wants to buy or sell.
Trend Tracking Indexes (TTIs)
These are the main indicators that tell you when to buy or sell Domestic and International ETFs (section 1 and 2). They do that by comparing their position to their long-term M/A (Moving Average). If they cross above, and stay there, it’s a green light to buy. If they fall below, and keep going, it’s a red light to sell. And to make sure you don’t lose your shirt if things go south, I also use a 12% trailing stop loss on all positions in these categories.
All other investment areas don’t have a TTI and should be traded based on the position of each ETF relative to its own trend line (%M/A). That’s why I call them “Selective Buy.” In other words, if an ETF goes above its own trend line, you can buy it. But don’t forget to use a trailing sell stop of 12%, or less if you’re feeling nervous.
If some of these words sound like Greek to you, please check out the Glossary of Terms and new subscriber information in section 9.
DOMESTIC EQUITY ETFs: BUY— since 11/21/2023
Click on chart to enlarge
This is our main compass, the Domestic Trend Tracking Index (TTI-green line in the above chart). It has broken above its long-term trend line (red) by +5.75% and is in “Buy” mode as posted.
The markets saw a slight uptick after the opening bell as traders navigated a flood of earnings reports from several mega-cap companies.
The overall outcome was positive for the major indexes, with Meta gaining 1.6% and Tesla rising 2.9%. However, Microsoft fell over 6% due to a disappointing revenue forecast. Notably, Tesla managed to shrug off both an earnings and revenue miss.
Looking ahead, Apple is set to report its earnings after the close today, while Amazon’s report is scheduled for next week. Nvidia also weighed on the market early, initially slipping nearly 4% before recovering to close 1% higher.
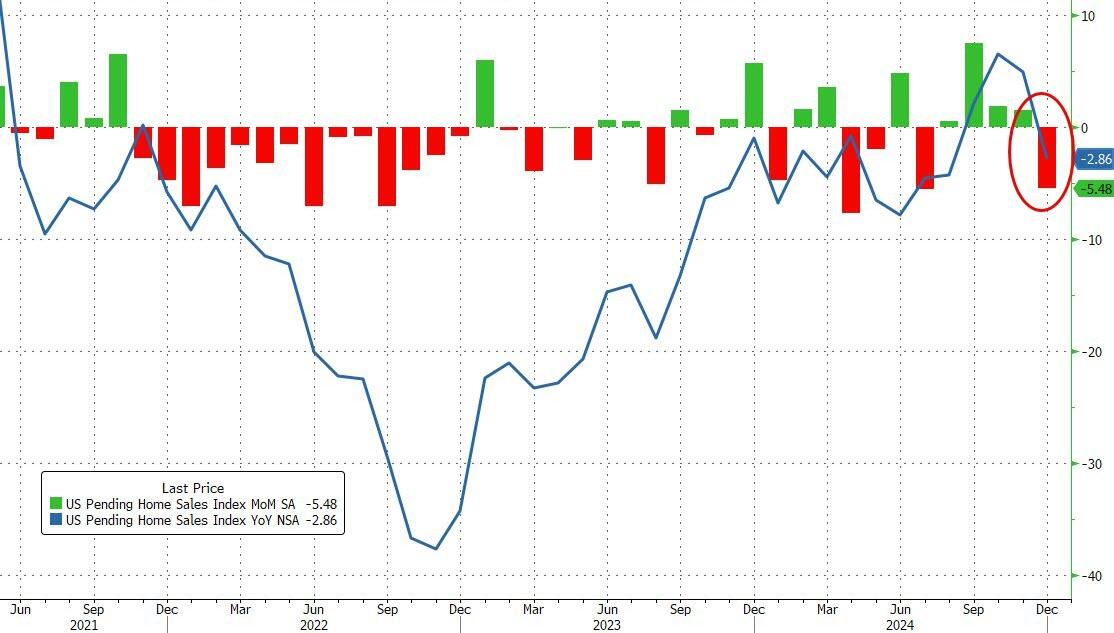
In economic news, fourth-quarter GDP growth was reported at 2.3%, falling short of the expected 2.6%. Additionally, pending home sales plunged 5.5% month-over-month in December, as high mortgage rates continued to reduce affordability.
Following Monday’s DeepSeek carnage, the most shorted stocks reversed direction, rallied, and provided support to equities in general. Bond yields experienced significant volatility but ended the day nearly unchanged.
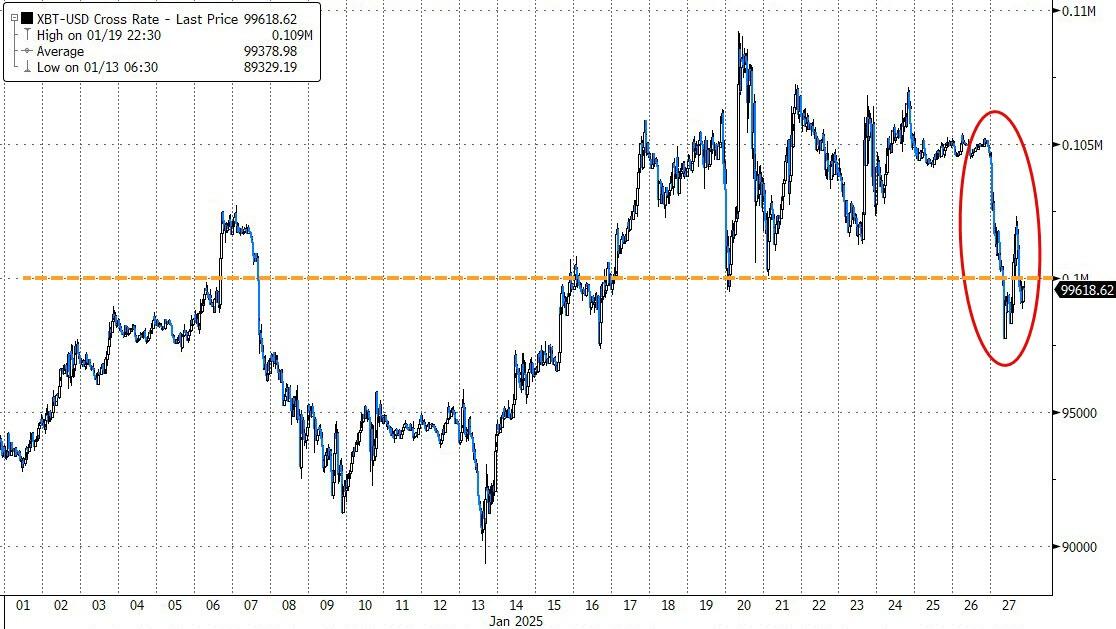
Bitcoin continued its relentless climb towards all-time highs, rallying to $106,000 and erasing all of Monday’s losses.
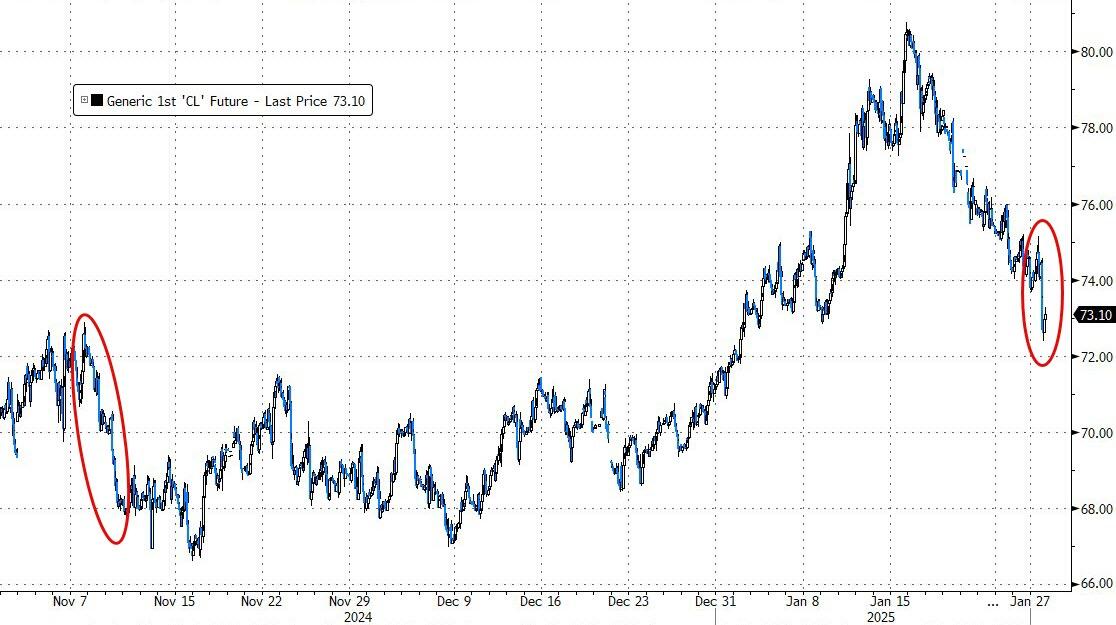
Oil prices spiked on news of tariffs announced by Trump, while gold surged to a new record high, closing just shy of $2,800. A further 7% rise would push gold to the coveted $3,000 level.
Will gold reach this milestone in the first half of 2025 or the second?
After yesterday’s comeback rally, equities slipped this morning ahead of the Federal Reserve’s latest policy decision on interest rates, expected after 11 am PST.
The odds were nearly 100% that the Central Bank will maintain rates within the target range of 4.25% to 4.5%. As usual, traders are primarily focused on Chairman Powell’s comments, especially since this is his first press conference in President Trump’s second term.
The Fed met Wall Street expectations by pausing rates as anticipated. However, Powell’s statement was somewhat more hawkish compared to last month, particularly with these notable points:
**FED: REMOVES REFERENCE TO INFLATION MAKING PROGRESS TOWARD GOAL**
As ZeroHedge pointed out, a strong labor market combined with no progress on inflation does not suggest rate cuts anytime soon.
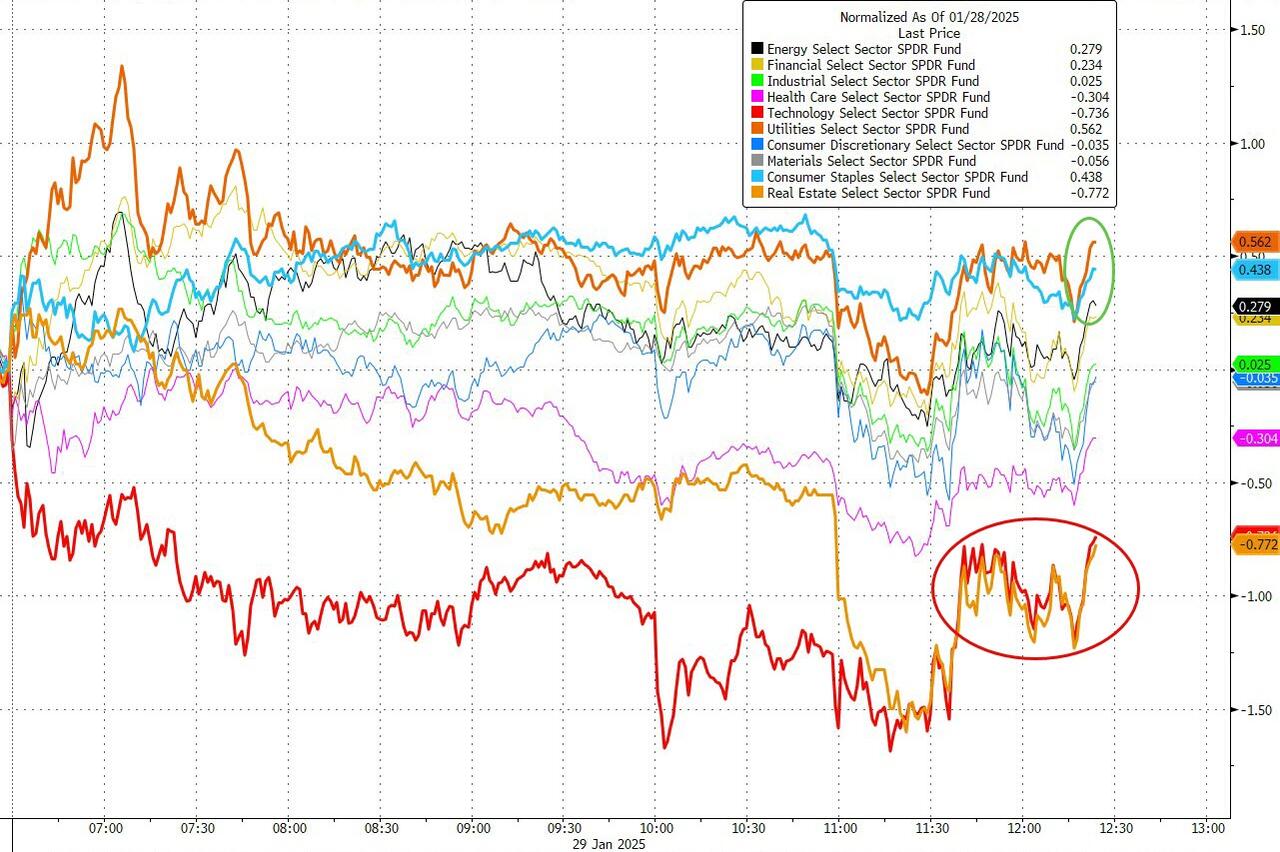
The major indexes reacted negatively, reversing some of yesterday’s gains. The Staples and Utilities sectors benefited, while Technology and Real Estate were the biggest losers.
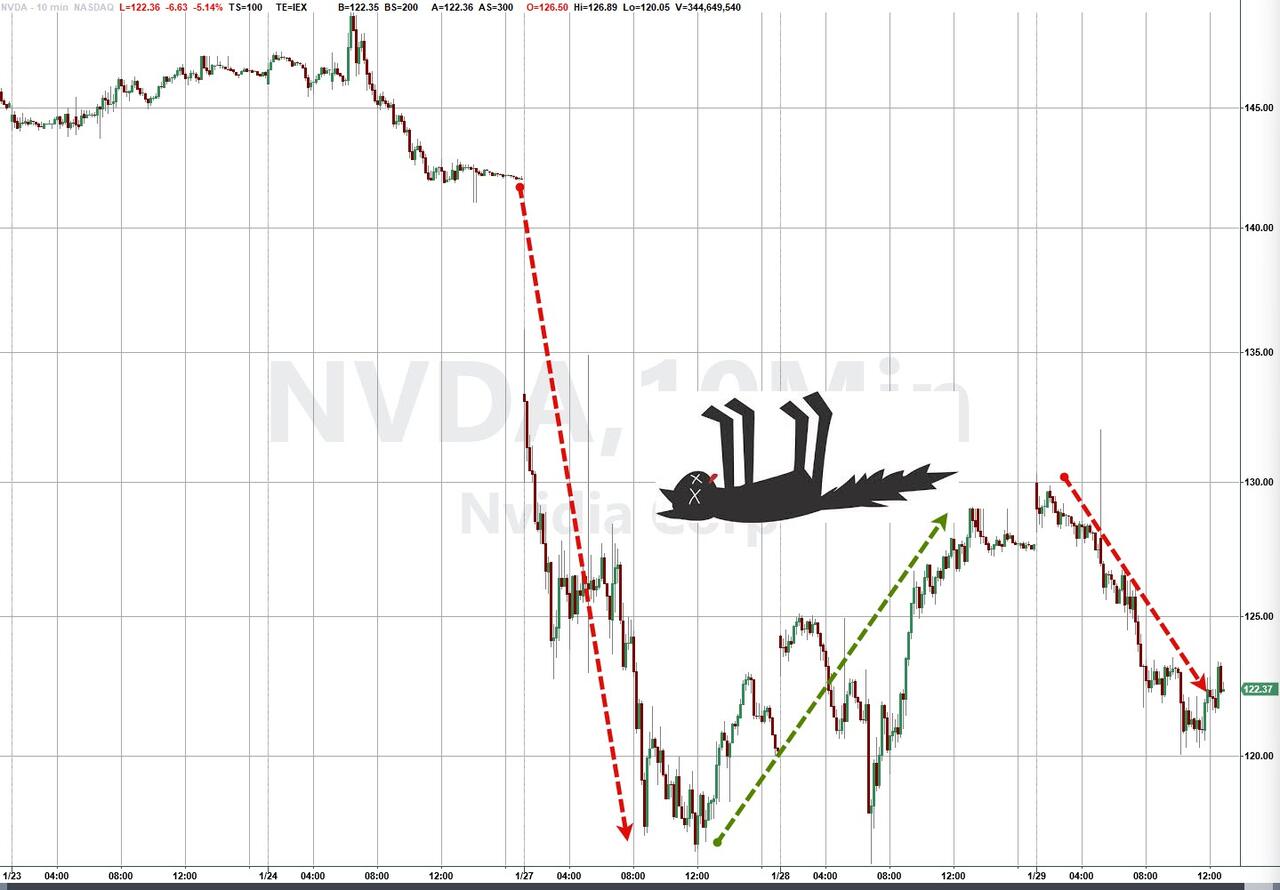
Nvidia, after recovering yesterday, took another 4% hit. Mega-Cap tech stocks initially dropped but managed to cut some early losses. However, their performance ahead of this afternoon’s earnings reports from META, MSFT, and TSLA remains to be seen.
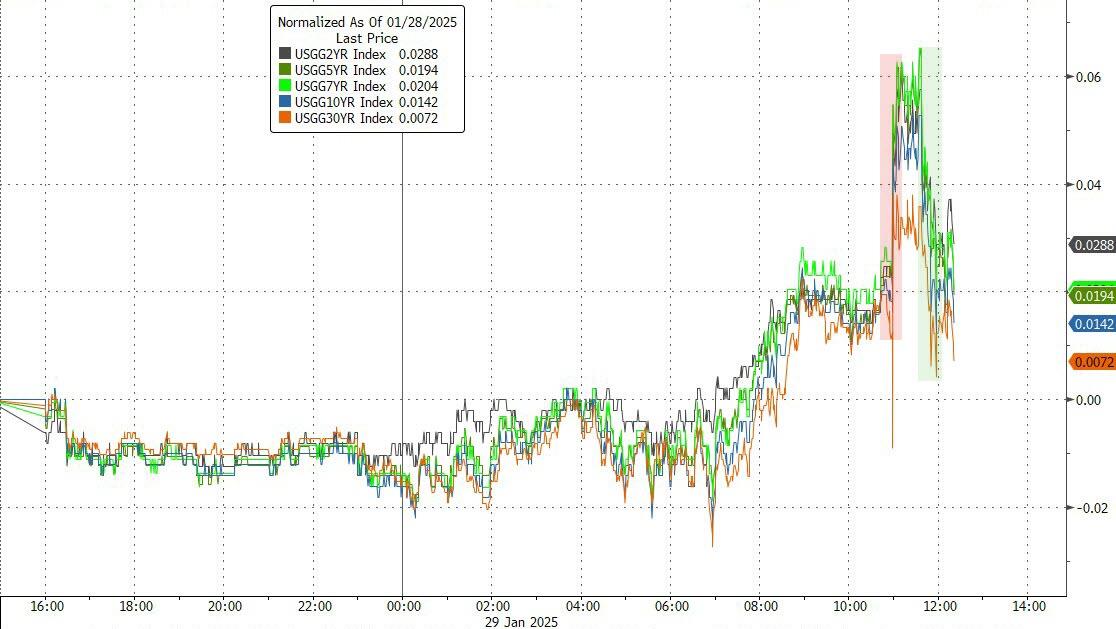
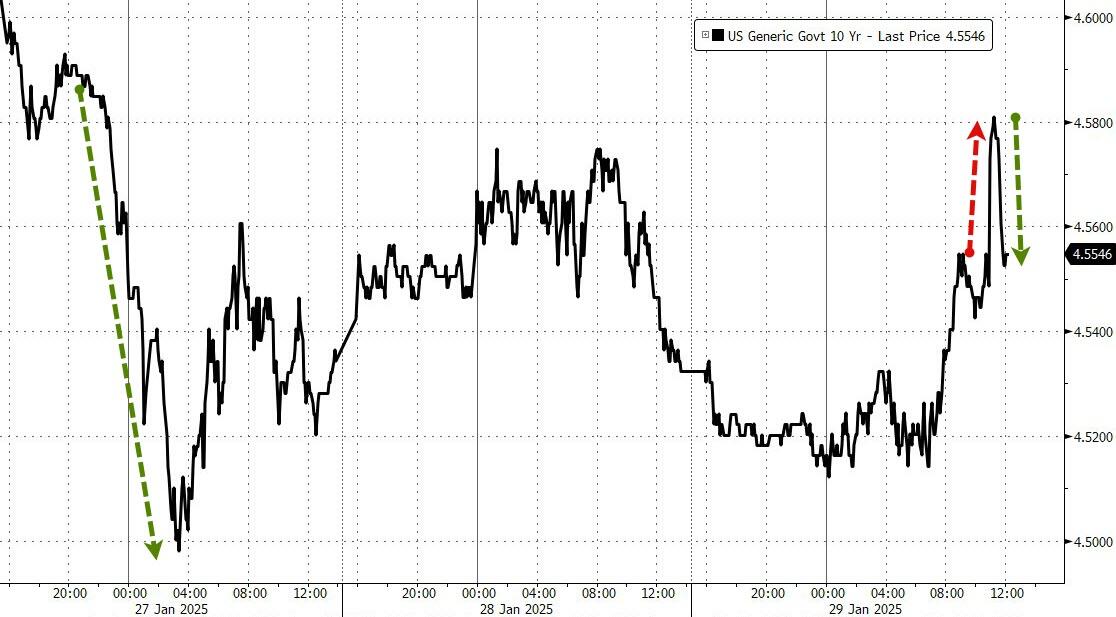
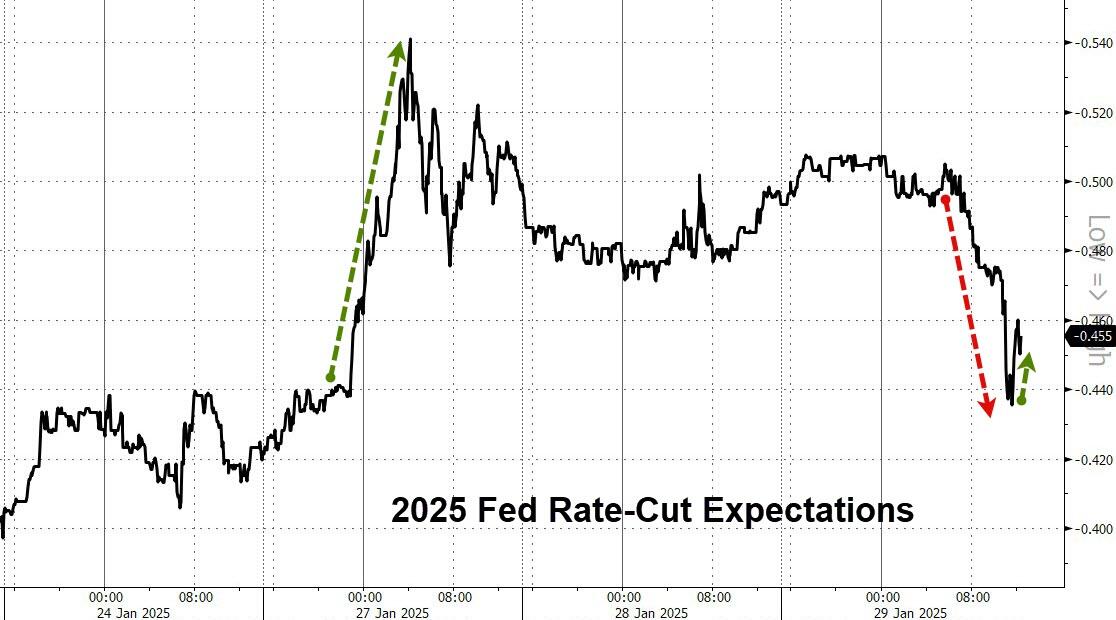
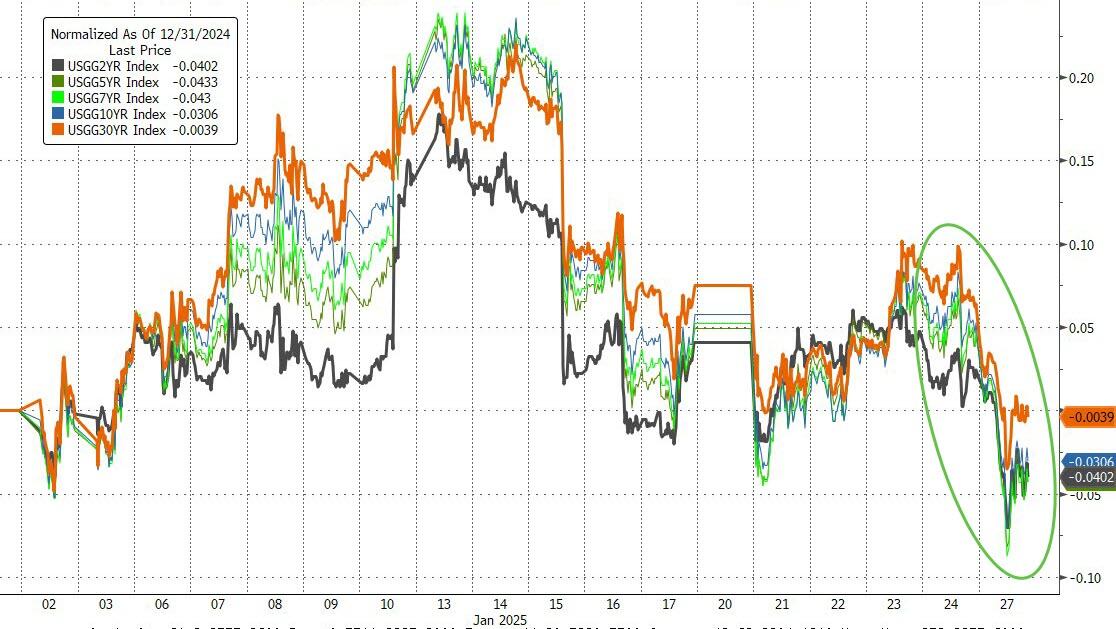
Bond yields surged initially but ended the session only slightly higher, with the 10-year yield swinging wildly intra-day. Rate-cut expectations tumbled, the dollar initially jumped then fell, gold slipped, but Bitcoin surged towards $105k, erasing Monday’s losses.
With President Trump calling for lower rates and the Fed maintaining its stance, will there be more contention ahead?
The major indexes experienced a sharp decline right after the market opened, driven by the emergence of a Chinese startup called DeepSeek.
This company posed a significant threat to existing AI models by offering competitive solutions at a fraction of the cost. Last week, DeepSeek released an open-source AI simulator that not only outperformed OpenAI’s models in various tests but also utilized less expensive chips and more efficient software. The model, introduced in December, was reportedly available for less than $6 million, a figure that analysts found hard to believe.
The immediate fallout in the tech sector was severe, with major players like Nvidia and Broadcom each dropping 12%, along with other mega-cap tech names. Given the already high valuations, this prompted profit-taking, with traders shifting their focus to more defensive positions.
This week, investors are anticipating quarterly results from the “Magnificent Seven” and the Federal Reserve’s meeting on interest rates. Current odds suggest a 99% chance that the Central Bank will leave rates unchanged.
On the economic front, there was positive news: the Chicago National Activity Index surged, home sales rose for the second consecutive year, and the Dallas Fed Manufacturing number saw its largest increase since the COVID-19 lockdown.
However, as ZH pointed out, these developments were overshadowed by DeepSeek’s affordable AI model, which dominated market sentiment. This led to a significant pullback in the S&P 500, the Nasdaq, and AI-related stocks, while the Dow remained unaffected and closed in the green.
Gold prices declined but stayed near record highs, and Bitcoin briefly fell below the $100k mark before rebounding. Oil prices collapsed as traders speculated that reduced data power demand would lead to lower energy resource requirements.
On a positive note, bond yields fell, with the 10-year yield retreating by nearly 10 basis points, and the dollar strengthened after bouncing off six-week lows.
The panic in the AI sector was profound, as big tech companies have invested hundreds of billions in the sector and rely on continuous revenue streams to remain viable and maintain margins. This new development may have hit a significant obstacle, and only time will reveal the true impact.


