Weekly StatSheet For The ETF Tracker Newsletter – Updated Through 08/04/2016

Ulli ETF StatSheet Contact

ETF Data updated through Thursday, July 21, 2016

TOC080416

Methodology/Use of this StatSheet:

  1. From the universe of over 1,800 ETFs, I have selected only those with a trading volume of over $5 million per day (HV ETFs), so that liquidity and a small bid/ask spread are assured.
  2. Trend Tracking Indexes (TTIs)

Buy or Sell decisions for Domestic and International ETFs (section 1 and 2), are made based on the respective TTI and its position either above or below its long-term M/A (Moving Average). A crossing of the trend line from below accompanied by some staying power above constitutes a “Buy” signal. Conversely, a clear break below the line constitutes a “Sell” signal. Additionally, I use a 7.5% trailing stop loss on all positions in these categories to control downside risk.

  1. All other investment arenas do not have a TTI and should be traded based on the position of the individual ETF relative to its own respective trend line (%M/A). That’s why those signals are referred to as a “Selective Buy.” In other words, if an ETF crosses its own trendline to the upside, a “Buy” signal is generated. Since these areas tend to be more volatile, I recommend a wider trailing sell stop of 7.5% -10% depending on your risk tolerance.

If you are unfamiliar with some of the terminology, please see Glossary of Terms and new subscriber information in section 9.

 1. DOMESTIC EQUITY ETFs: BUY — since 4/4/2016

TTI

Our main directional indicator, the Domestic Trend Tracking Index (TTI-green line in the above chart) remains above its long-term trend line (red) by +3.04% after having generated a new Domestic Buy signal effective 4/4/2016 as posted.
Read More

Mixed And Choppy

Ulli Market Commentary Contact

Thur pic

[Chart courtesy of MarketWatch.com] 

1. Moving the Markets

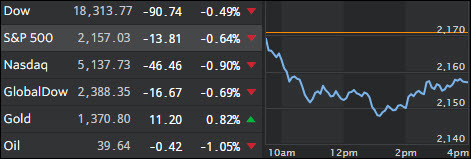
Swinging aimlessly above and below the unchanged line was the theme of the day for the major indexes despite oil shifting into high gear again by gaining 2.3%. There was obvious caution ahead of tomorrow’s Labor report but Treasuries were higher as jobless claims rose while factory orders dropped. Both, the US dollar and gold edged up.

European equities closed up as financials took the lead powered by the Bank of England’s (BoE) benchmark interest rate cut from 0.5% to 0.25%. That, for the time being, put the worries about the ongoing Italian banking crisis on the back burner, but I am sure it will surface again in the not too distant future.

From time to time I feature charts comparing the highly disconnected S&P 500 to underlying realities as presented by real numbers such as GDP, Earnings as measured by GAAP and others. Thanks to ZH, here is another long-term one showing the S&P 500 vs. US factory orders. Take a peek:

Read More

Indexes Make An About Face; Tesla Dissapoints

Ulli Market Commentary Contact

Wed pic

[Chart courtesy of MarketWatch.com]

 1. Moving the Markets

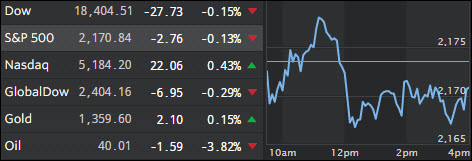
Stocks turned the boat around today, which entailed the Dow snapping a seven-session losing streak. The market had lost momentum over the past week, as shares have been weighed down by a fourth straight quarter of negative profit growth for the S&P 500, above-average valuations and a renewed dip in oil prices. U.S.-produced crude had tumbled more than 20% from its recent high and below $40 per barrel, before jumping back up above the $40 mark today.

Despite the recent soft patch for stocks, the Dow is down just 1.5% from its July 20 all-time high and remains up 5.1% on the year. Similarly, the S&P 500 is down less than 1% from its July 22 record and is up 5.5% in 2016.

Wall Street also got more good news on the jobs front. Private employers added 179,000 jobs in July, topping expectations and lifting hopes that the government’s July employment report set for release Friday will also come in solid.

In earnings news, Telsa Motors (TSLA) showed the continued strain of building an electric automaker with even grander ambitions, announcing second quarter losses that did not meet Wall Street expectations. The company reported losing $2.09 a share, or $293 million.

Read More

Dow Slides Again; Oil Closes Below $40 A Barrel

Ulli Market Commentary Contact

Tue pic

[Chart courtesy of MarketWatch.com]

1. Moving the Markets

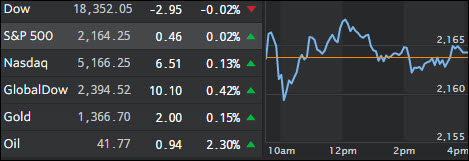
If you read yesterday’s commentary, you may remember me discussing the possibility that U.S. Crude oil could fall below $40 a barrel. Well, today it happened, which is completely opposite of how analysts were expecting the black gold to perform this summer. Many had pegged $50 per barrel as a mark that oil would surpass in the late summer months, but that has not been the case. Oversupply from Saudi Arabia, Iraq and the fact that the U.S. is increasing their rig count continues to be driving the price down and the time frame for when prices could turn upwards seems to get longer as each day passes.

In auto news, General Motors (GM) and Ford (F) posted U.S. sales declines in July, while Fiat Chrysler posted a small increase, as the U.S. automakers grapple with what appears to be a showroom plateau, albeit at record-high levels. Disappointed investors fled each automaker’s stock. Shares of both companies fell more than 4% on the day.

Europe contributed to part of the weakness in equities as the recent bank stress test was a total failure with the broad bank stock index now down some 7% from recent highs. Italian banks are hovering at records lows while behemoths like Deutsche Banks and Credit Suisse are being kicked out of the Stoxx 50 index as of this coming Monday. Right now, it appears that barring any sudden appearance of a suitor to bail out the European banking system, we may see more weakness in global equities.

Read More

Mediocre Monday; Uber Hails Ride Back From China

Ulli Market Commentary Contact

Mon pic

[Chart courtesy of MarketWatch.com]

1. Moving the Markets

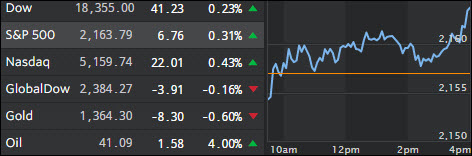
U.S. stocks were mixed Monday as a two-week period of relative stability in the markets continued despite a sharp slide in oil prices.

In Uber news, we heard today that the company is officially “bowing out” of the China market. Uber’s Chinese operations will merge with Beijing-based ride hailing firm Didi Chuxing. Didi said in a statement it would take over all of Uber China and operate it as a separate brand. In exchange, the company said, Uber will receive a stake in Didi and Uber founder Travis Kalanick will join the Chinese company’s board. The deal is set to be worth about $35 billion.

Eyes moved sharply back to oil today, as the price of West Texas Intermediate (WTI) fell slightly below $40 mid-day. On Monday, the price of WTI, the U.S. benchmark, closed 3.7% lower, to $40.06 as traders remained concerned about a surplus of global supplies. In early May, many were speculating that prices would move (and stay) above $50 a barrel for the summer months. However, signs of increasing production and reduced geopolitical disruption have sent the commodity in an opposite direction this summer in what looks like a repeat of 2015. The last time it closed below $40 a barrel was April 18, when it settled at $39.78.

Of course, the divergence between WTI and the S&P 500 has grown to more extreme levels as ZH reports here with the following chart being a true eye opener. Take a look:

Read More

One Man’s Opinion: Global Central Banks Are All-In: QE Running At Record $180 Billion Per Month (And Rising)

Ulli Market Review Contact

OneMan'sOpinionBy ZeroHedge

The monetary policy beatings will continue until morale improves. Eight long years after monetary policy experimentation went extreme, Reuters reports the amount of QE stimulus being pumped into the world financial system has never been higher… and it’s about to get bigger.

As Jamie McGeever reports, The European Central Bank and Bank of Japan are buying around $180 billion of assets a month, according to Deutsche Bank, a larger global total than at any point since 2009, even when the Federal Reserve’s QE programme was in full flow.

Read More