
- Moving the market
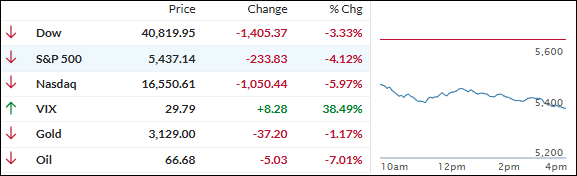
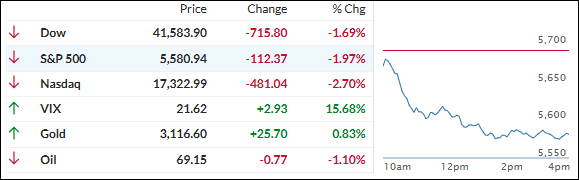
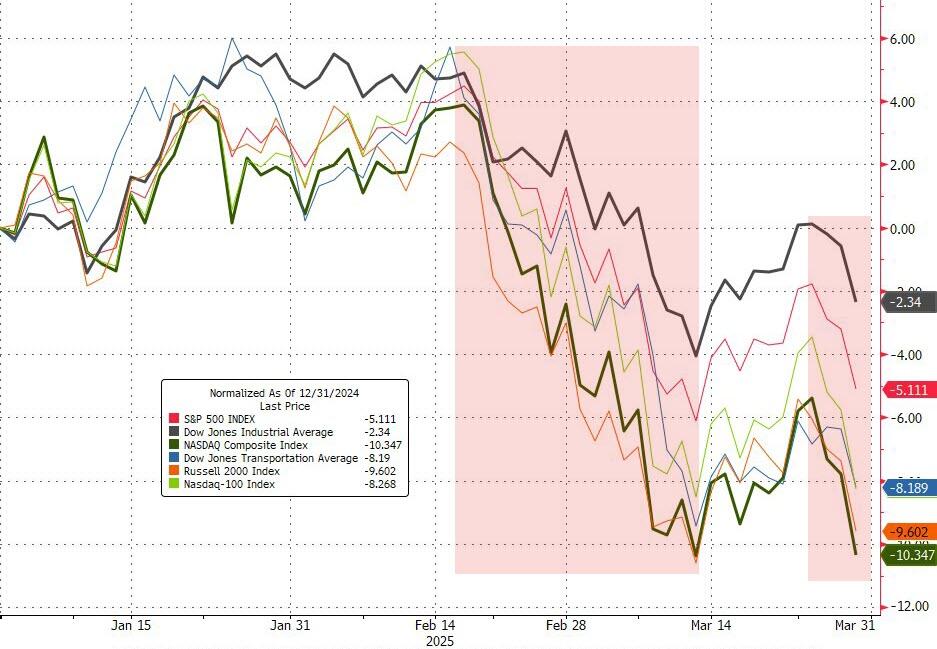
Last night, the futures market experienced a pump-and-dump, reflecting the market’s reaction to Trump’s tariff policies. This morning, the sell-off continued, with major indexes and the broader market dropping sharply.
As a result, our domestic TTI entered “Sell” mode, and I liquidated our last domestic position in my advisory practice. We are now holding only a few selected sector ETFs.
The sell-off was broad, affecting most asset classes, including those considered “safe” havens. Many traders are highly leveraged, and when margin calls arrive, they liquidate any assets they own to meet requirements.
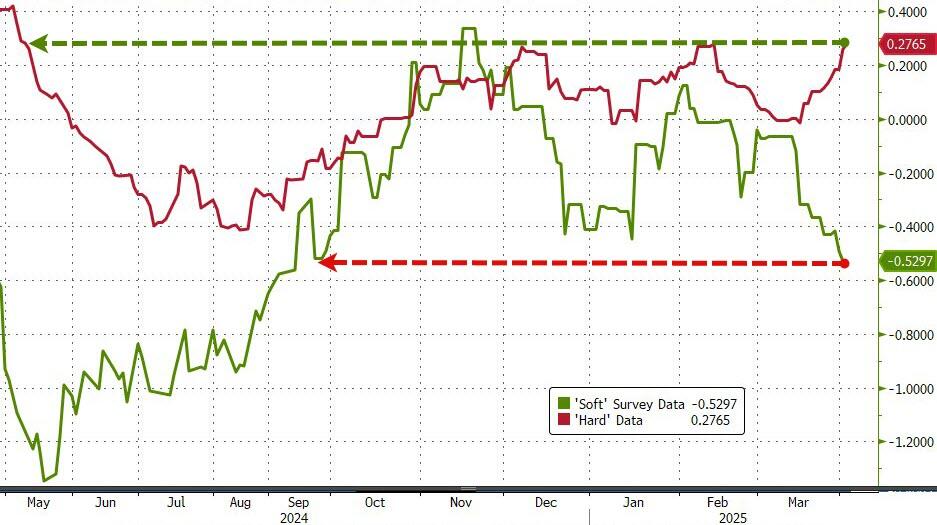
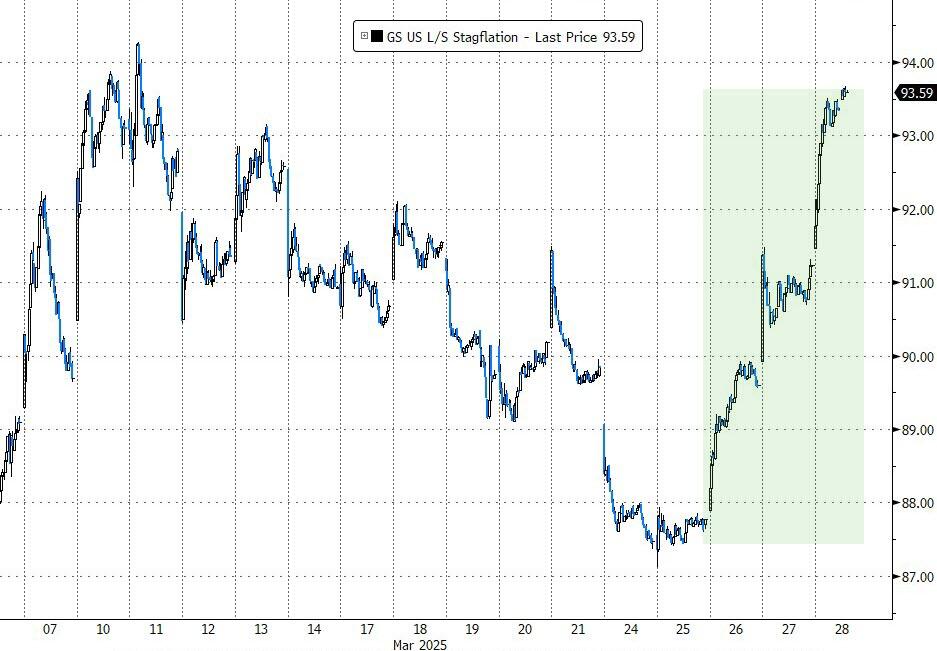
Trump’s tariffs were extensive but only covered about half of the tariffs imposed on the U.S. for decades. Despite not being fully reciprocal, traders and algorithms viewed them negatively due to the potential risks of a global trade war amid a slowing U.S. economy.
At the NY Stock Exchange, decliners outnumbered advancers by six to one. Shares of multinational companies like Nike (-15%) and Apple (-9%) were hit hardest, while global stock markets slumped 3% overnight.
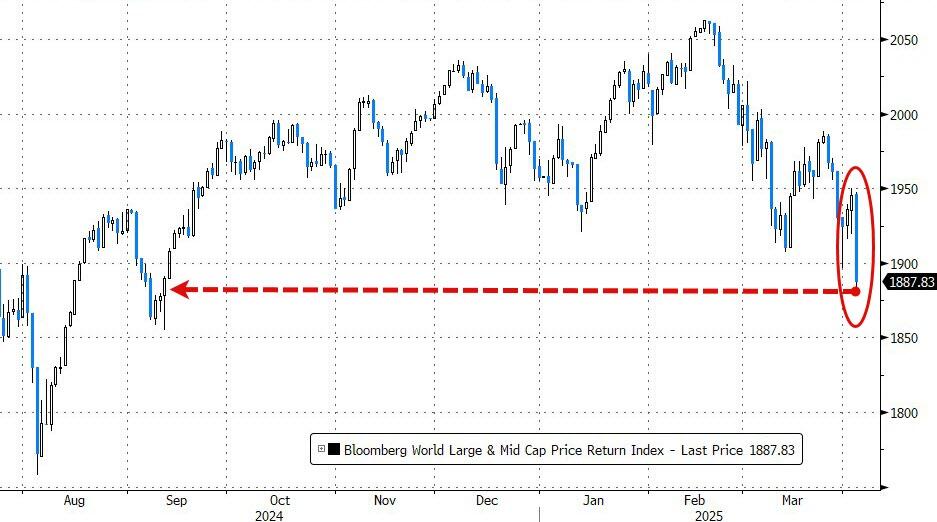
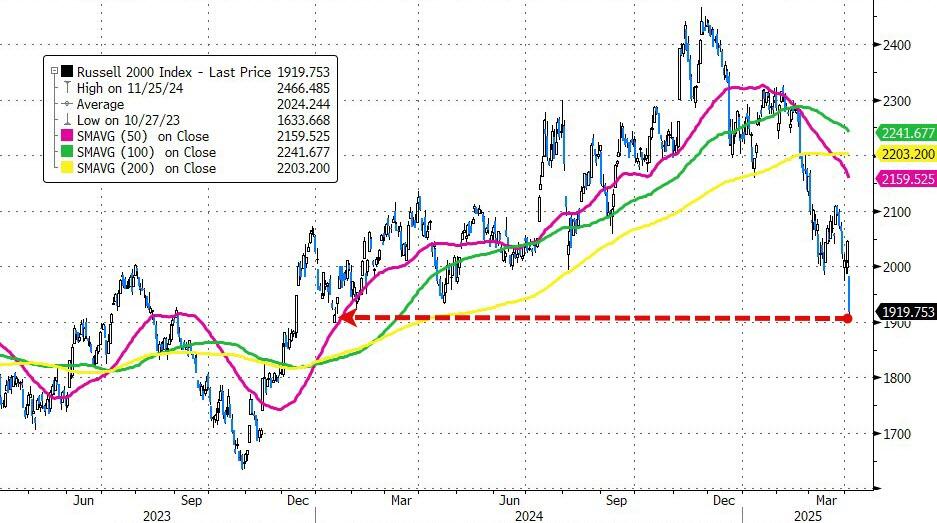
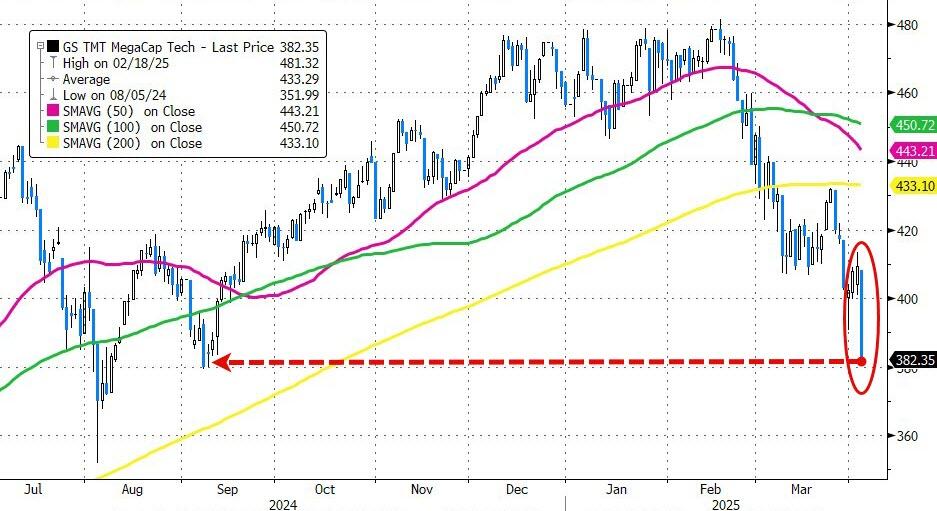
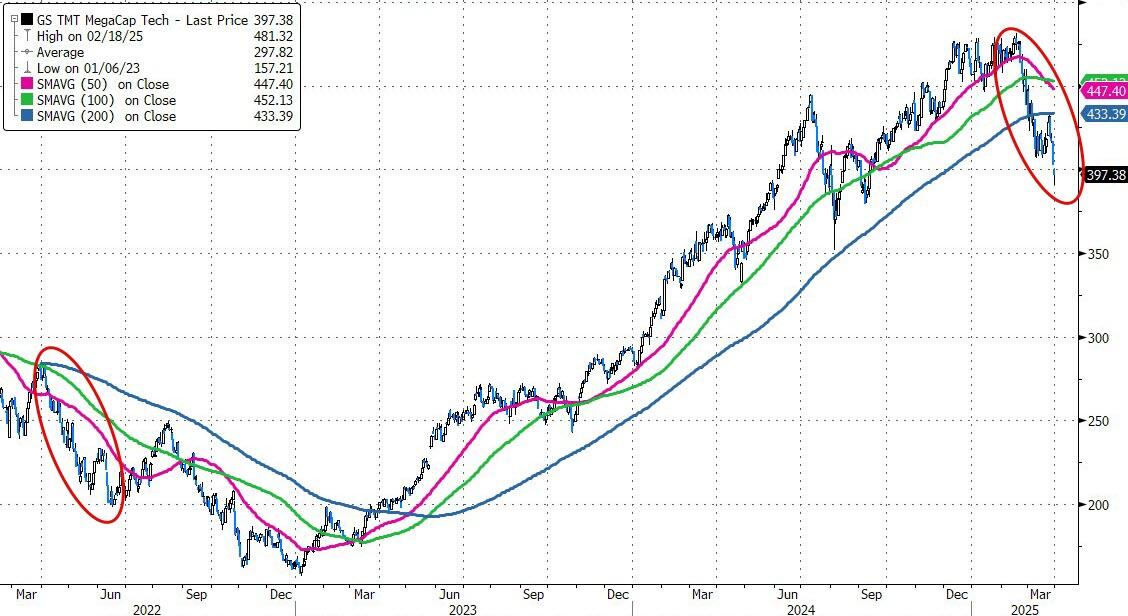
The S&P 500 suffered its biggest daily loss since June 2020, closing at its lowest point of the day. Small Caps fell to their lowest level since January 2024, and Mega Cap tech stocks dropped to their lowest level since September.
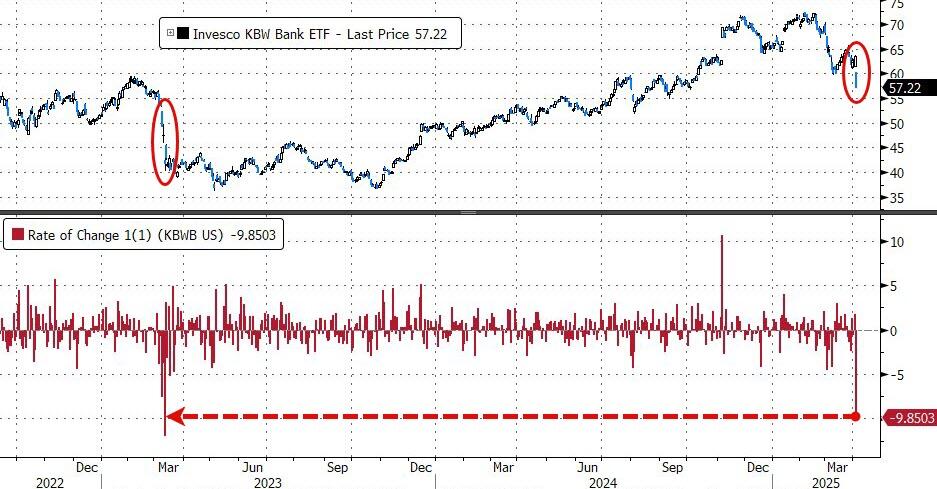
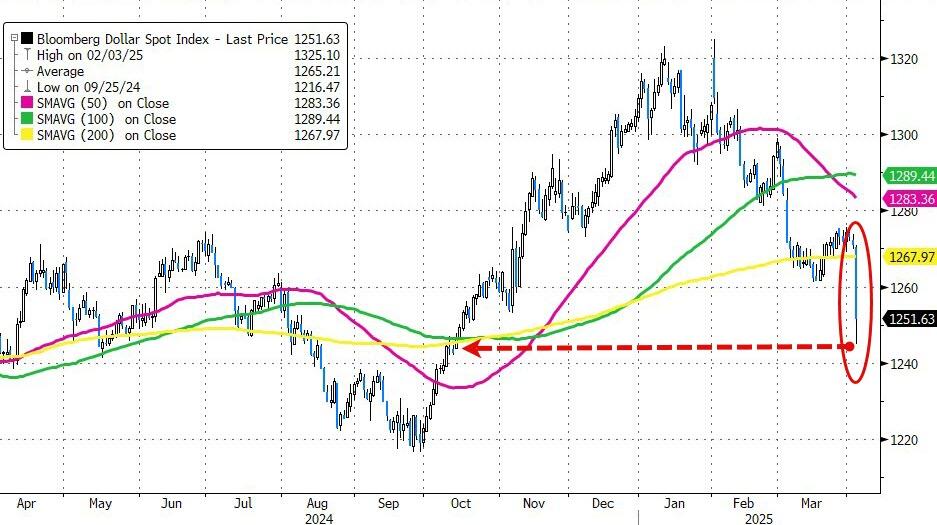
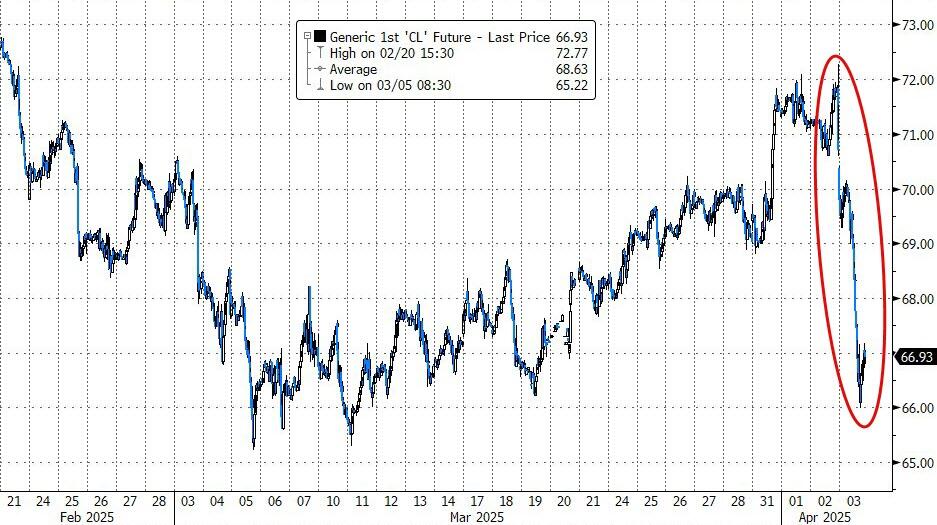
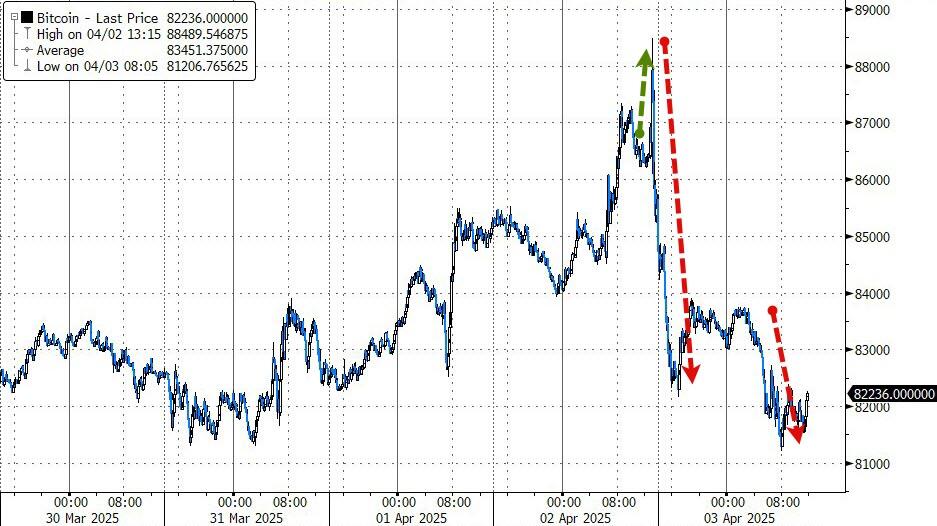
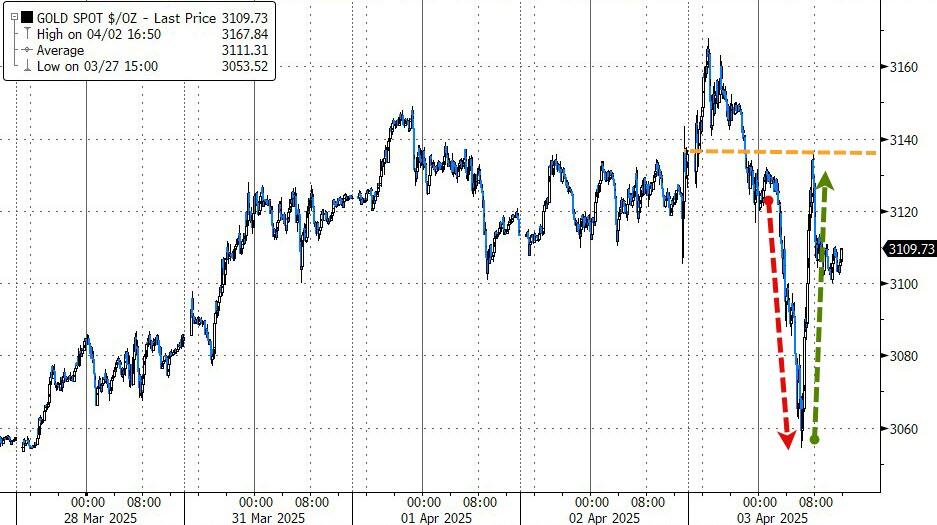
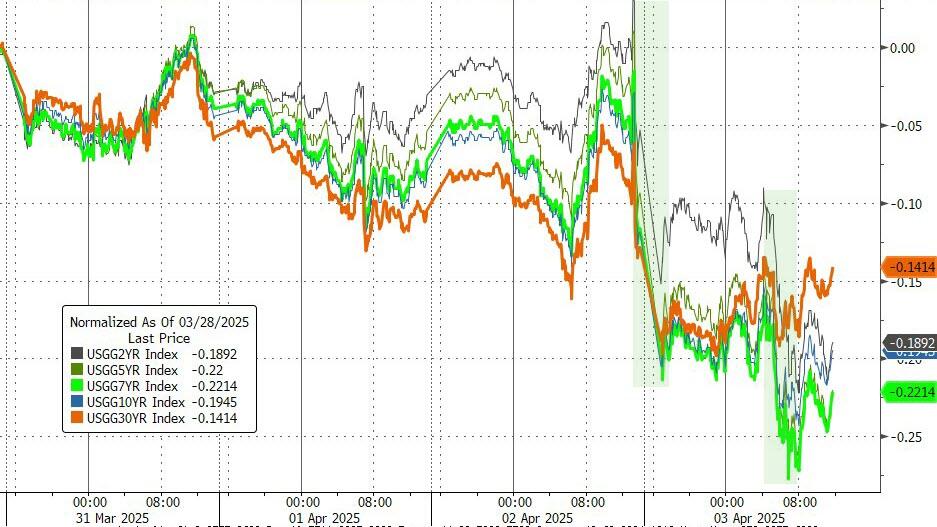
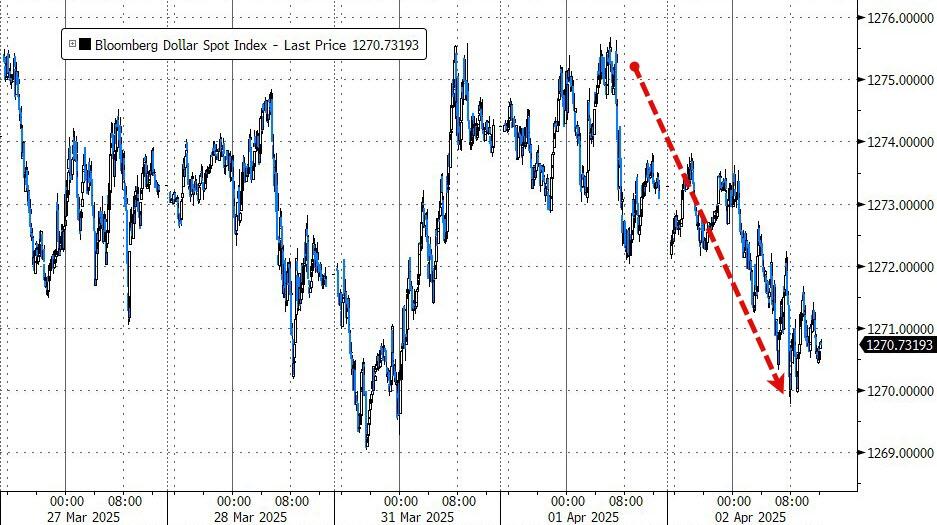
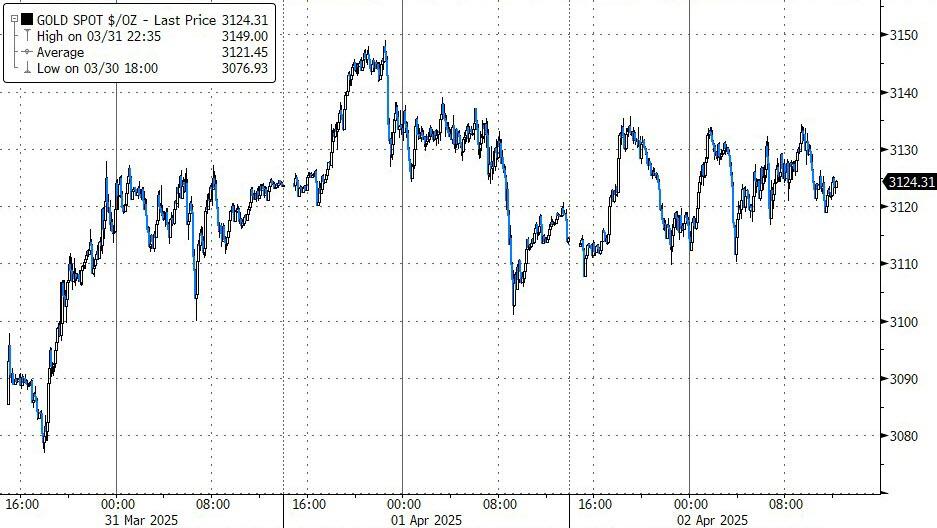
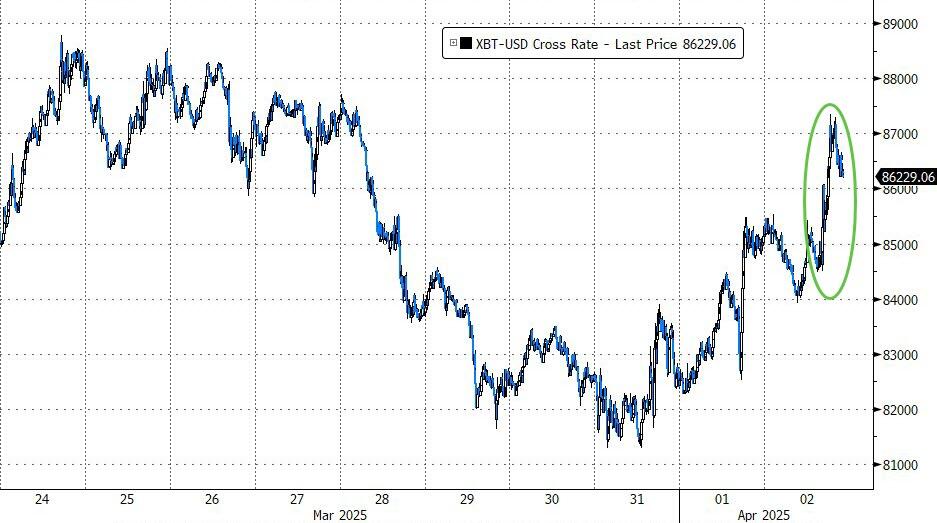
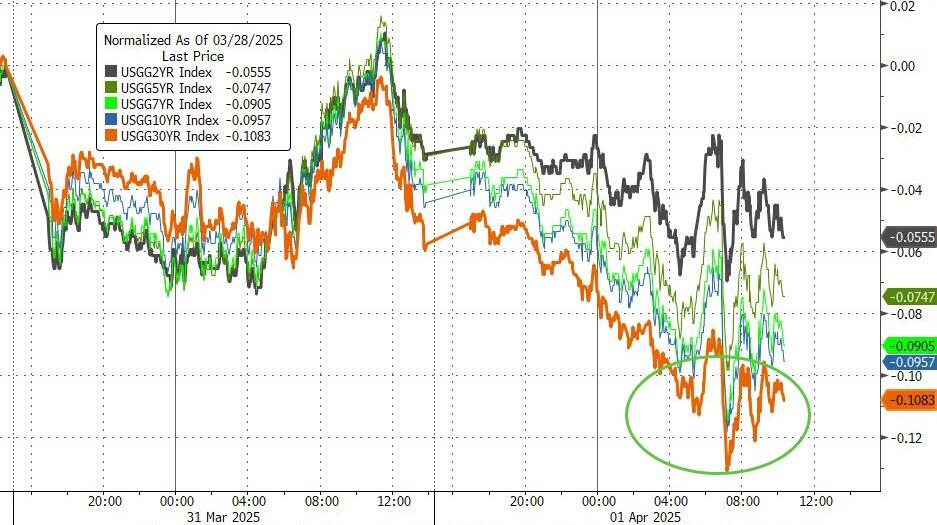
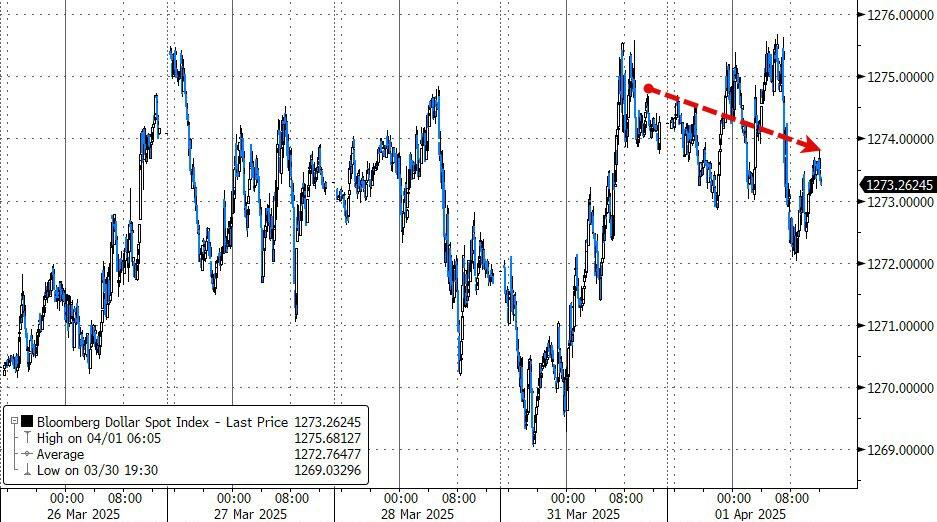
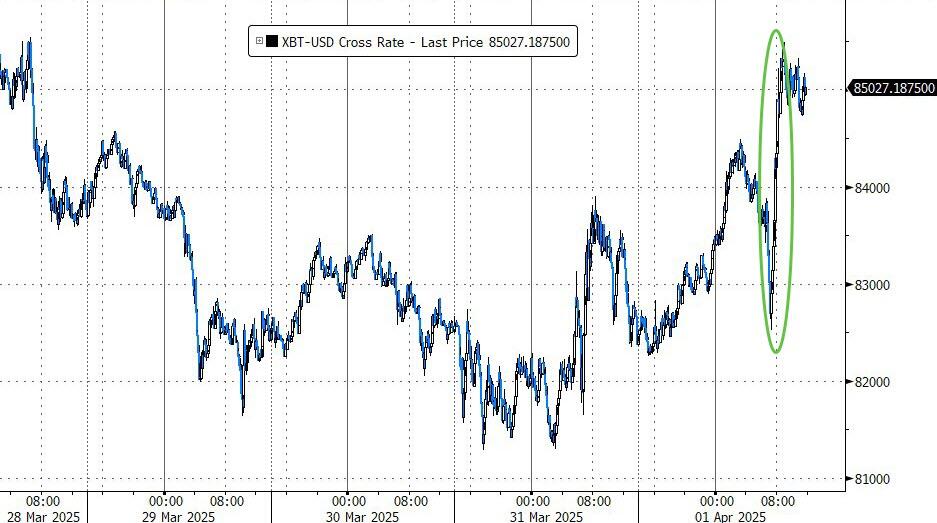
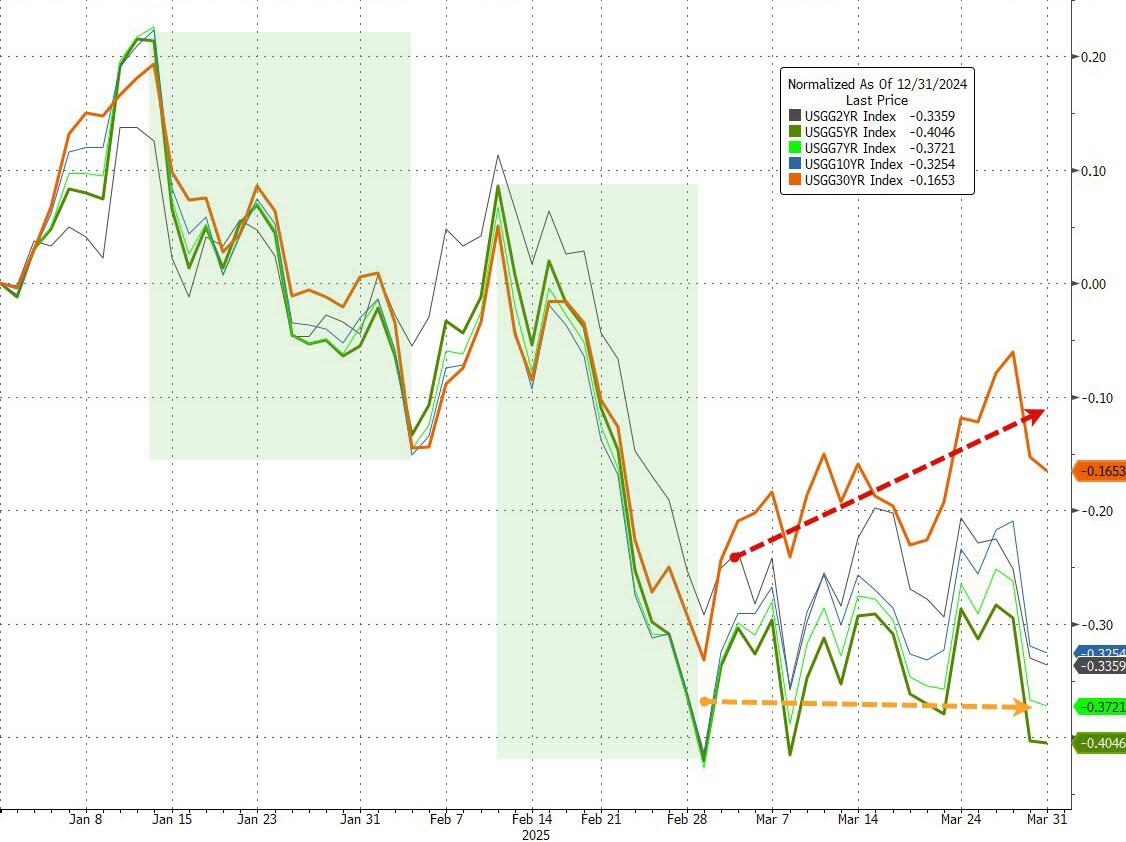
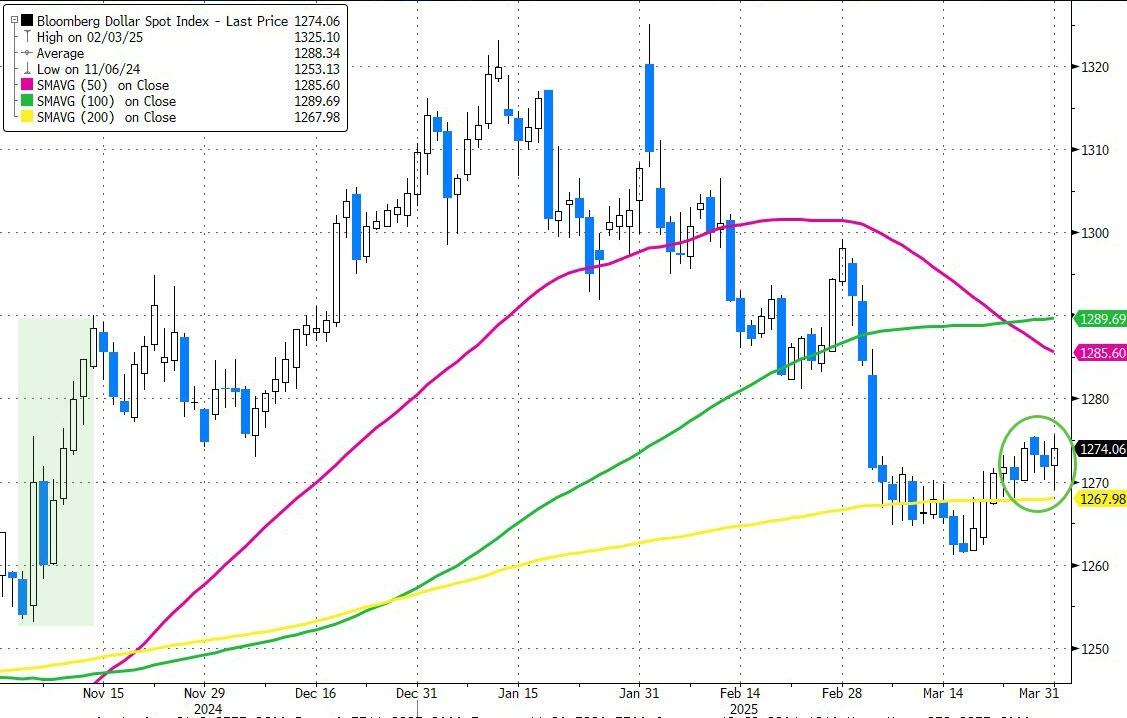
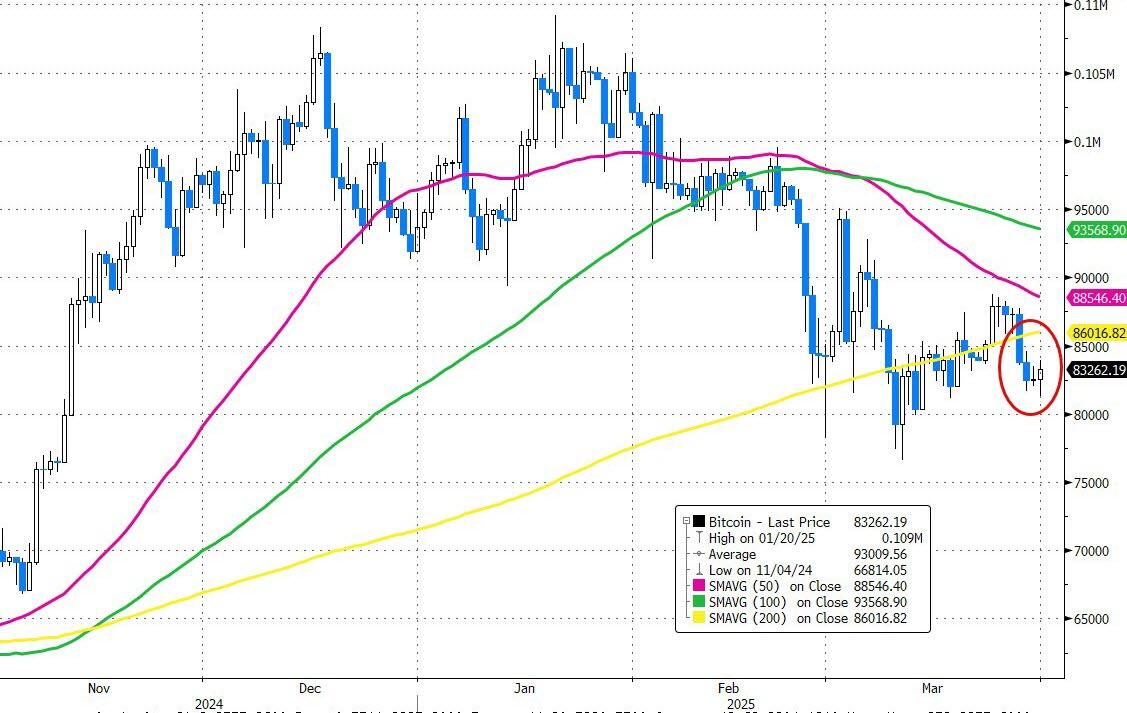
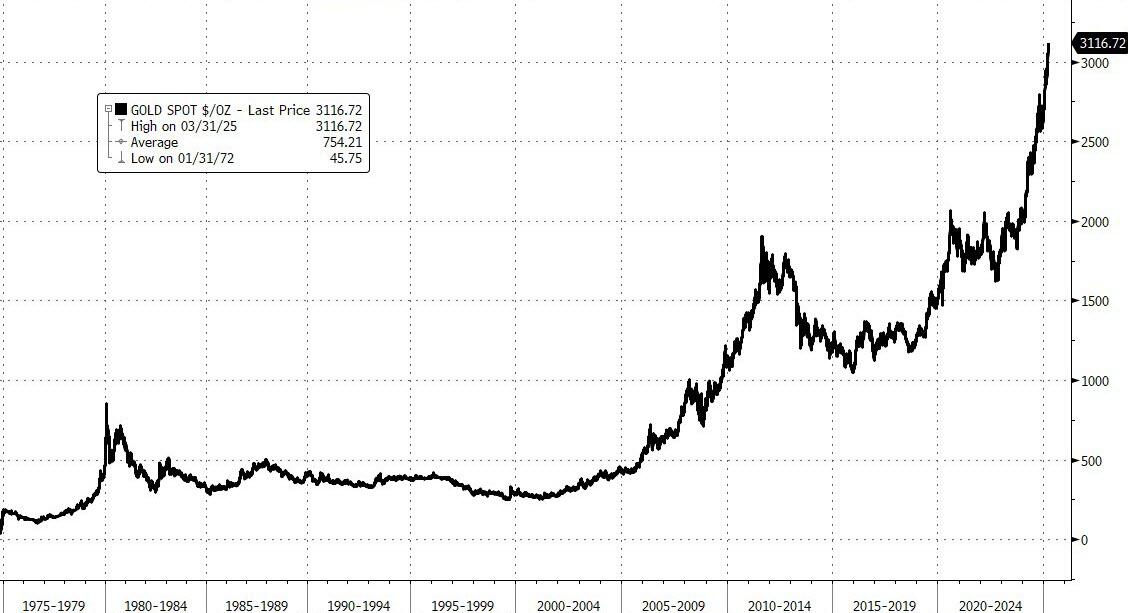
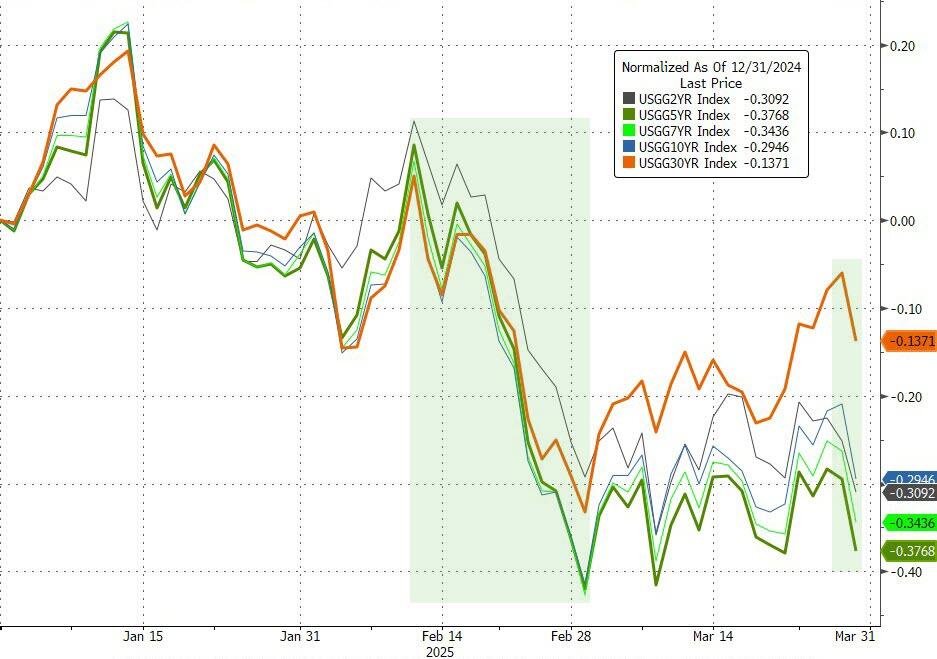
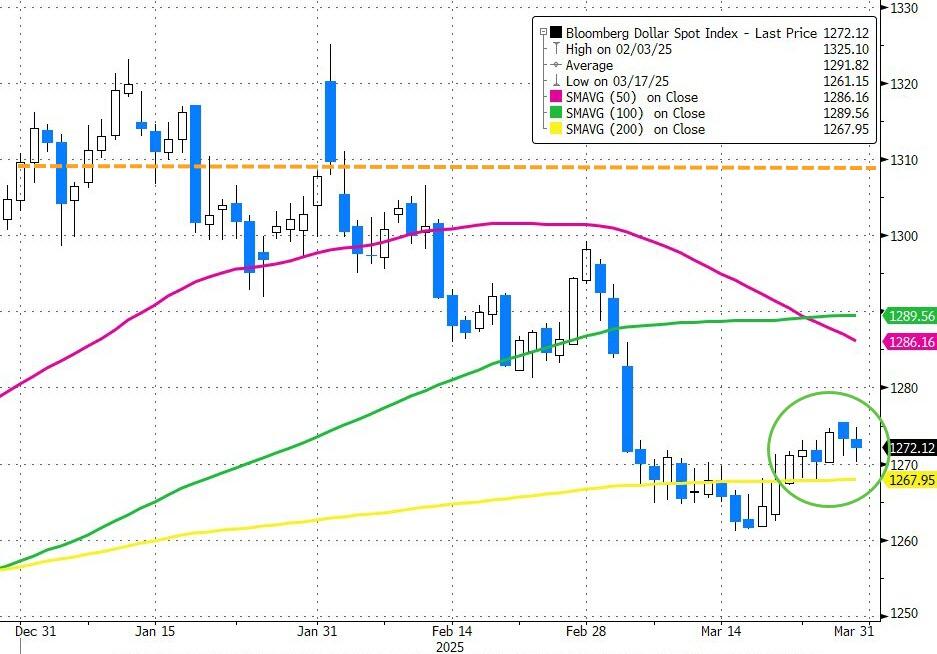
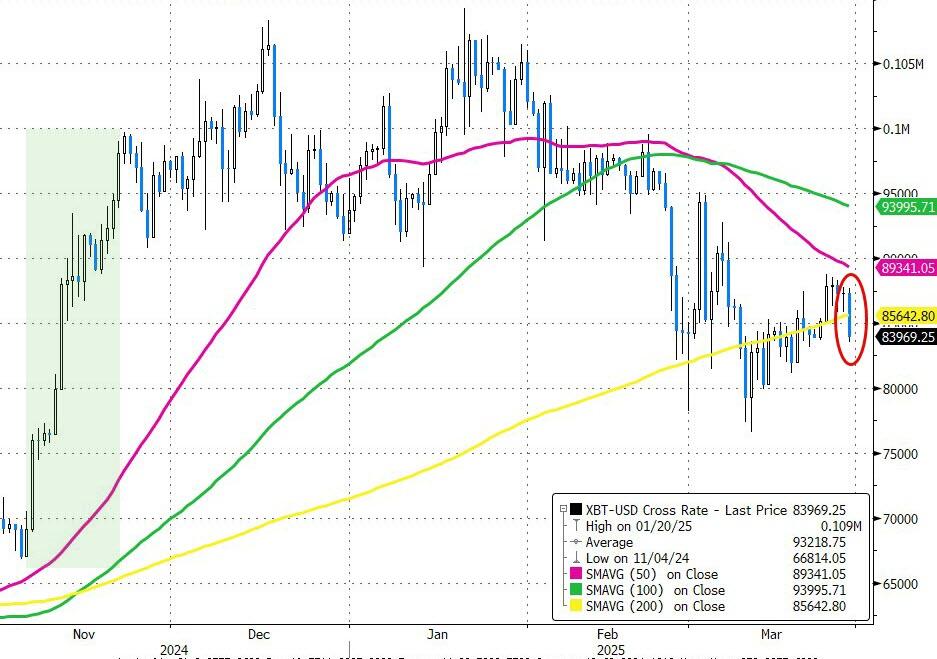
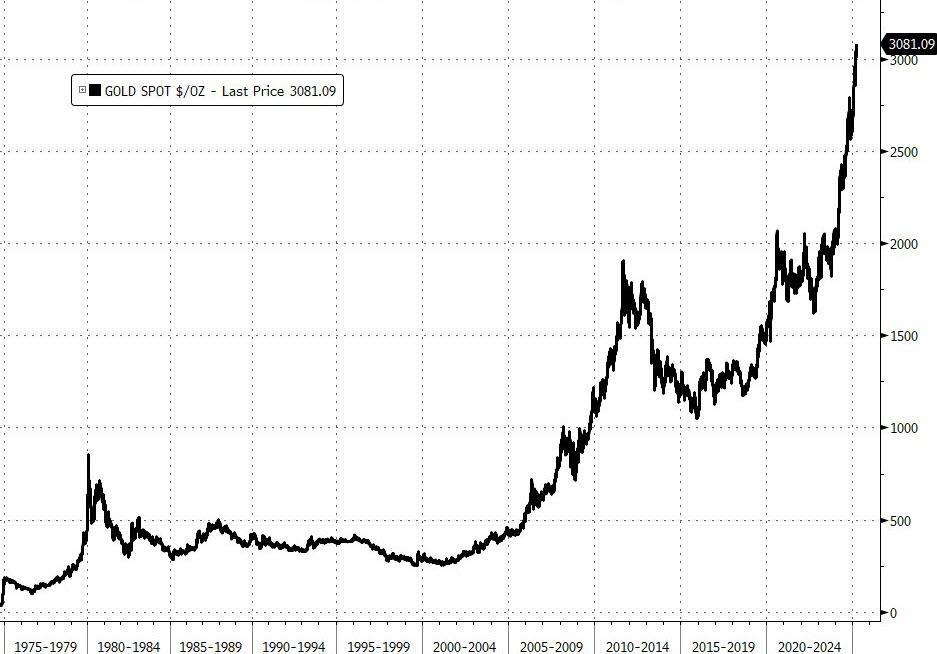
Banks were heavily impacted, the dollar fell below its 200-day moving average, and crude oil lost nearly 7%. Bitcoin gave back its recent gains, gold fluctuated but remained above $3,100. Despite a drop in bond yields, it wasn’t enough to support the markets.
With uncertainty about market direction prevailing, it’s wise to stay on the sidelines in the safety of money market funds until a new bull market can be identified.
Read More