Energy Provides Support For The Bulls

Ulli Market Commentary Contact

[Chart courtesy of MarketWatch.com]
  1. Moving the Markets

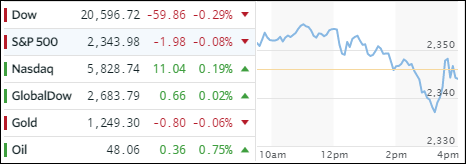
Finally, the energy sector showed some signs of life with the widely followed XLE gaining +1.3% for the day while barely crawling back above its 200-day M/A by a fraction. XLE has been in a solid downtrend since early December 2016. Oil gave an assist as well by rebounding +2.15%. More help for the bulls came from the consumer sector (XLY), which added +0.60% for the day after bouncing of its 50-day M/A three days ago, but it’s too early to tell if that is the continuation of the recent bullish trend or just a dead cat bounce.

The major indexes started the day below the unchanged line but, as we’ve seen recently, were magically pushed higher throughout the day closing mixed with the Nasdaq leading the pack by adding +0.38%. While the benchmark S&P 500 was able to eke out a tiny gain of +0.11%, it still down for the month by a fraction of a percent.

Wall Street is still in limbo trying to figure out what to make of the Republican’s failure to pass a health care bill and if there could be more fallout in regards to Trump’s agenda of tax reform and massive infrastructure plan. While no one has an answer yet, I believe that these plans will not come of fruition until 2018 at best and at reduced numbers. If that proves correct, the markets will have to deal with the fact that they again may have gotten ahead of themselves. I wonder when that reality will sink in.
Read More

Stocks Rebound In The Face Of A Rallying Dollar And Higher Rates

Ulli Market Commentary Contact

[Chart courtesy of MarketWatch.com]
  1. Moving the Markets

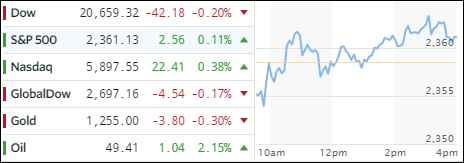
Yesterday, I talked about how the Dow was on its worst losing streak since 1978 if it would hit one more down day. That dubious record was prevented as, right out of the gate this morning, the computer algos went into overdrive by slamming the VIX (volatility index) on 4 different occasions to make sure that the major indexes not just rebounded but also maintained their upward momentum. At the end of the day, all three indices ended solidly in the green, and the mission was accomplished.

The helping headline that Consumer Confidence soared to the highest level since the peak of the dot-com bubble in 2000 gave an assist but had some questioning the accuracy of that statement. Meanwhile, Gallup presented some different numbers as their most recent survey showed that the US Economic Confidence Index (ECI) dropped six points for the week ending March 26, which is the lowest weekly average since the presidential election. Makes me wonder how such divergence is possible.

Across the markets, banks finally managed to pick up some steam after the recent drubbing, the dollar index rallied +0.58% but still stayed below the psychologically important 100 level. Interest rates rose with the 10-Year Treasury gaining 4 points to settle at a yield of 2.42%.

Read More

Dollar And Financials Head South; Equities Recover

Ulli Market Commentary Contact

[Chart courtesy of MarketWatch.com]
  1. Moving the Markets

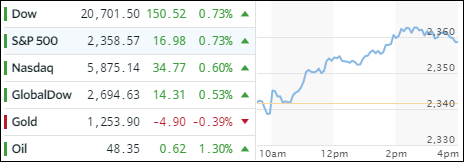
Equities looked to be on a slippery slope this morning with all indexes starting the day being underwater by about -1%. For a change, dip buyers stepped in and off to the races we went recouping almost all losses at the close. However, the Dow now has notched its 8th down day in a row, its longest losing streak since 2011. If it hits 9 tomorrow, that would be the worst spell since 1978.

Banks got clobbered again but managed to recoup some of the losses. Goldman Sachs has been on the skids 14 of the last 16 days, its worst drop since January 2016. That also means that banks have dipped into the red for the year, which not exactly a sign of confidence. Hat tip goes to ZH for these stats.

The leader continues to be the tech sector confirmed by our SMH ETF in the daily “Spotlight listings,” which has been holding on to the #1 spot for some time (see section 2 below). Energy as a whole has been lagging as oil continues on its slippery path south ending the day below $48/barrel.

The dollar dropped again and lost -0.47% for the day despite the Fed’s recent hike in interest rates. It has now erased about 80% of its post-Trump gains meaning that the “reflation theme” based on Trump’s economic projections may not play out as planned, at least not for the time being. Precious metals have been the winner of the dollar’s collapse.

Read More

One Man’s Opinion: David Stockman Offers “More Proof Of Janet Yellen’s Idiocy”

Ulli Market Review Contact

Authored by David Stockman via The Daily Reckoning,

During the last 129 months, the Fed has held 86 meetings. On 83 of those occasions it either cut rates or left them unchanged.

So you can perhaps understand why Wednesday’s completely expected (for the last three weeks!) 25 bips left the day traders nonplussed. The Dow rallied over 100 points that day.

Traders understandably believe that this monetary farce can continue indefinitely, and that our Keynesian school marm’s post-meeting presser was evidence that the Fed is still their friend.

No it isn’t!

Janet Yellen’s sing-song gibberish was the equivalent of a monetary DEFCON 1, alerting all except the most addicted Kool-Aid drinkers to get out of the casino.

Our monetary politburo has expanded its balance sheet by a lunatic 22X during the last three decades and in the process has systematically falsified financial asset prices and birthed a mutant debt-fueled of simulacrum of prosperity.

But once it begins to withdraw substantial amounts of cash from the canyons of Wall Street as per its newly reaffirmed “normalization” policy, the whole house of cards is destined to collapse.

Read More

ETFs On The Cutline – Updated Through 03/24/2017

Ulli ETFs on the Cutline Contact

Below please find the latest High Volume ETFs Cutline report, which shows how far above or below their respective long-term trend lines (39 week SMA) my currently tracked ETFs are positioned.

This report covers the HV ETF Master List from Thursday’s StatSheet and includes 366 High Volume ETFs ETFs, defined as those with an average daily volume of more than $5 million, of which currently 221 (last week 224) are hovering in bullish territory. The yellow line separates those ETFs that are positioned above their trend line (%M/A) from those that have dropped below it.

Take a look:

The HV ETF Master Cutline Report            

In case you are not familiar with some of the terminology used in the reports, please read the Glossary of Terms.

If you missed the original post about the Cutline approach, you can read it here.

ETF Tracker Newsletter For March 24, 2017

Ulli ETF Tracker Contact


ETF Tracker StatSheet

https://theetfbully.com/2017/03/weekly-statsheet-etf-tracker-newsletter-updated-03232017/

HEALTH CARE BILL FAILS; MARKETS SINK

[Chart courtesy of MarketWatch.com]
  1. Moving the Markets

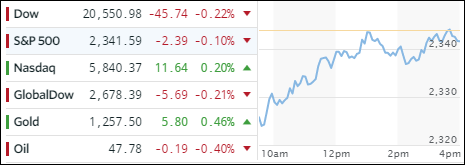
In a repeat performance of yesterday, an early rally stalled and reversed leaving the major indexes about unchanged for the day but down for the week with the S&P 500 surrendering some -1.4%.

As I mentioned throughout the week, the most widely watched news event was the path of the health care bill and whether Trump could muster enough votes in his own party to get the legislation through congress. The answer was finally revealed, before the markets closed, as Republicans pulled the bill prior to the voting procedure admitting that it could not get passed in its present form.

That leaves the question as to what market reaction might be come next week. On view is that this is an ominous sign for Trump’s ability to push through his economic agenda while, on the other hand, you could argue that, with this monkey off his back for the time being, other things that are not as complicated like lowering taxes and reducing regulations, might be more doable.

Market internals looked like this: This is the Dow’s longest losing streak (7 days) since election. Small Caps had their worst week since February 2016. The S&P 500 had its worst five trading days since November while the Financials suffered their worst week since January 2016.

The greenback continued its slide for the 8th losing day in a row, which is the longest losing streak for the Bloomberg Dollar Index since April 2011. Treasury yields dropped on the week, despite the Fed’s rate hike on 3/15, which gave bond investors a reason to cheer as bonds finally rallied. Gold was the winner again, and the precious metal is now up for 2 weeks in a row, its best 2-week period since Brexit in 2016.

Read More