ETFs On The Cutline – Updated Through 07/14/2017

Ulli ETFs on the Cutline Contact

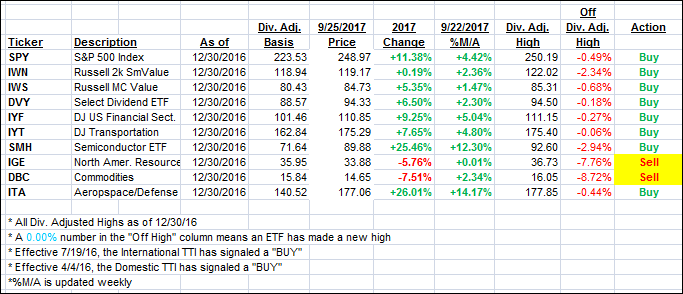
Below please find the latest High Volume ETFs Cutline report, which shows how far above or below their respective long-term trend lines (39 week SMA) my currently tracked ETFs are positioned.

This report covers the HV ETF Master List from Thursday’s StatSheet and includes 366 High Volume ETFs ETFs, defined as those with an average daily volume of more than $5 million, of which currently 277 (last week 246) are hovering in bullish territory. The yellow line separates those ETFs that are positioned above their trend line (%M/A) from those that have dropped below it.

Take a look:

The HV ETF Master Cutline Report            

In case you are not familiar with some of the terminology used in the reports, please read the Glossary of Terms.

If you missed the original post about the Cutline approach, you can read it here.

ETF Tracker Newsletter For July 14, 2017

Ulli ETF Tracker Contact

ETF Tracker StatSheet

https://theetfbully.com/2017/07/weekly-statsheet-etf-tracker-newsletter-updated-07132017/

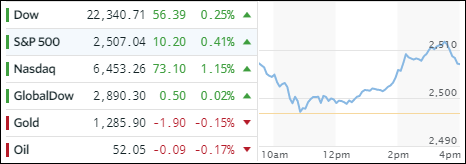
WEAK DATA PROPELS INDEXES TO RECORD TERRITORY

[Chart courtesy of MarketWatch.com]
  1. Moving the Markets

It did not matter that consumer sentiment tumbled to its lowest since the election or that Retail sales were down -0.2% posting their weakest growth in 3 years, nor suggestions that Q2 GDP estimates might be revised sharply lower.

It was simply another day where bad news was good news, and the major indexes reacted accordingly by closing out the week solidly in the green. The S&P 500 and Dow managed to hit intra-day highs while the Nasdaq had its best weak of 2017. Even the recent weakness of the FANG stocks came to an end as they had their best 5 trading sessions in 3 months.

The 20-year T-Bond swung in a wide range but closed up only a scant +0.12%. The US dollar took another licking, gapped down and made new lows for the year with UUP dropping -0.61%.

It was another wild day in the markets, which ZH summed up nicely:

After months of hawkishness, Yellen drops a slight hint at ‘dovishness’ on the rate-hike trajectory and stocks soar to record highs, VIX closes at a record weekly low, bonds rally, crude oil rips, and gold has best week in months…oh, and macro data dumps!

Read More

Weekly StatSheet For The ETF Tracker Newsletter – Updated Through 07/13/2017

Ulli ETF StatSheet Contact

ETF Data updated through Thursday, July 13, 2017

Methodology/Use of this StatSheet:

  1. From the universe of over 1,800 ETFs, I have selected only those with a trading volume of over $5 million per day (HV ETFs), so that liquidity and a small bid/ask spread are assured.
  2. Trend Tracking Indexes (TTIs)

Buy or Sell decisions for Domestic and International ETFs (section 1 and 2), are made based on the respective TTI and its position either above or below its long-term M/A (Moving Average). A crossing of the trend line from below accompanied by some staying power above constitutes a “Buy” signal. Conversely, a clear break below the line constitutes a “Sell” signal. Additionally, I use a 7.5% trailing stop loss on all positions in these categories to control downside risk.

  1. All other investment arenas do not have a TTI and should be traded based on the position of the individual ETF relative to its own respective trend line (%M/A). That’s why those signals are referred to as a “Selective Buy.” In other words, if an ETF crosses its own trendline to the upside, a “Buy” signal is generated. Since these areas tend to be more volatile, I recommend a wider trailing sell stop of 7.5% -10% depending on your risk tolerance.

If you are unfamiliar with some of the terminology, please see Glossary of Terms and new subscriber information in section 9.


  1. DOMESTIC EQUITY ETFs: BUY — since 4/4/2016

Click on chart to enlarge

Our main directional indicator, the Domestic Trend Tracking Index (TTI-green line in the above chart) is positioned above its long-term trend line (red) by +3.40% after having generated a new Domestic Buy signal effective 4/4/2016 as posted.

Read More

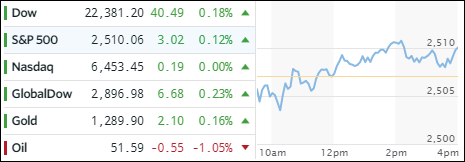
Day 2 Of Yellen’s Testimony: Dow Rides Into Record Territory

Ulli Market Commentary Contact

[Chart courtesy of MarketWatch.com]
  1. Moving the Markets

The recent trend of warnings from various Fed mouthpieces continued today with Lael Brainard commenting that “asset valuations do look a bit stretched,” another hint designed to take the starch out of upward momentum and to instill the thought that current market levels may not be sustainable.

It was a nice try, but after a brief morning sell-off, the bulls took over and pushed the major indexes back into the green with the Dow posting its 24th record of 2017. Even news that the revised healthcare bill may lack the necessary votes again, could not keep the trading algos from pushing the indexes higher.

The Nasdaq notched its 5th up-day in a row. Financials supported the rally with XLF gaining +0.60%. SmallCaps recovered from early weakness and emerging markets (SCHE) added +0.39%. A big assist came from the retail sector with XRT rising +2.31% ignoring its bearish trend in what looks like a dead cat bounce.

Interest rates rose and the 20-year T-Bond TLT gave back yesterday’s gains. The US dollar (UUP) whipsawed but ended the session +0.04% higher.

Read More

Fed’s Yellen Flip Flops And Spikes Equities

Ulli Market Commentary Contact

[Chart courtesy of MarketWatch.com]
  1. Moving the Markets

This one came out of left field. Fed chair Yellen’s testimony before congress was interpreted as “dovish” an odd statement given the recent jawboning about “asset prices looking rich.” After weeks of talking about higher rates and reducing its balance sheet, did the Fed just flip flop and acknowledge once again its ignorance? Be that is it may, all traders needed to hear were those always hoped for words that “rates may not rise much from here” and off to the races we went.

The major indexes scored some nice gains across the board with the Nasdaq being the lead dog again. Semiconductors did well with SMH gaining +1.44%, but Emerging Markets topped the list with SCHE adding +1.95%. Transportation (IYT) had a good day by scoring +1.20%.

Bonds rallied with the 20-year T-bond gapping up and gaining +0.69%, which was the best day in about a month. Gold and oil joined the party, but the whipping boy of the day was the US dollar which, in light of the Yellen’s dovish statement, headed south again.

It remains to be seen if this market reaction was simply irrational or the basis for further advances. The upcoming earnings season will certainly play a big role in this outcome.

Read More

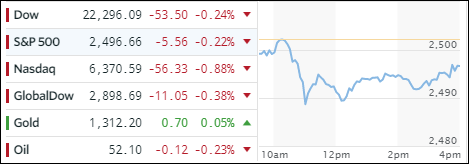
Another Roller-Coaster Ride

Ulli Market Commentary Contact

[Chart courtesy of MarketWatch.com]
  1. Moving the Markets

An early climb back to the unchanged line unraveled all of a sudden as the markets reversed and plunged on news about Trump Jr. releasing a chain of emails alleged to have played a role of Russian involvement in the Trump Sr. election. The soap opera continued for a while but, after the knee-jerk reaction, the major indexes spent the rest of the day trying to conquer the unchanged line.

The mission was accomplished with the exception of the S&P 500, which fell short by a tad. Throwing an assist was news by the Senate that they would delay their summer recess until the third week of August in order to work on crucial matters such as the health-care bill and tax cuts; if you can believe that.

The Nasdaq was the winner again and SmallCaps managed to squeeze out a solid gain of +0.24%. Yields on T-bonds were mixed with 20-year bouncing off the lows and closing above the unchanged line by +0.17%. The US dollar (UUP) was not so lucky and lost -0.36% and is now honing in on its October 2016 lows.

Read More