One Man’s Opinion: The Economy Is Okay?! U.S. Retail Store Closings Hit New Record High As West Coast Homelessness Soars

Ulli Market Review Contact

By Michael Snyder

If the U.S. economy is doing just fine, why have we already shattered the all-time record for retail store closings in a single year?  Whenever I write about our “retail apocalypse”, many try to counter my arguments by pointing out the growing dominance of Amazon.  And I certainly can’t deny that online shopping is on the rise, but it still accounts for less than 10 percent of total U.S. retail sales.  No, something bigger is happening in our economy, and it isn’t receiving nearly enough attention from the mainstream media.

Back in 2008, a plummeting economy absolutely devastated retailers and it resulted in an all-time record of 6,163 retail stores being closed that year.

So far in 2017, over 6,700 stores have been shut down and we still have nearly two months to go!  The following comes from CNN…

Read More

ETFs On The Cutline – Updated Through 11/10/2017

Ulli ETFs on the Cutline Contact

Below please find the latest High Volume ETFs Cutline report, which shows how far above or below their respective long-term trend lines (39 week SMA) my currently tracked ETFs are positioned.

This report covers the HV ETF Master List from Thursday’s StatSheet and includes 366 High Volume ETFs ETFs, defined as those with an average daily volume of more than $5 million, of which currently 247 (last week 262) are hovering in bullish territory. The yellow line separates those ETFs that are positioned above their trend line (%M/A) from those that have dropped below it.

Take a look:

The HV ETF Master Cutline Report            

In case you are not familiar with some of the terminology used in the reports, please read the Glossary of Terms.

If you missed the original post about the Cutline approach, you can read it here.

ETF Tracker Newsletter For November 10, 2017

Ulli ETF Tracker Contact

ETF Tracker StatSheet

https://theetfbully.com/2017/11/weekly-statsheet-etf-tracker-newsletter-updated-11092017/

MORE TAX-CUT DELAY TALK SPOOKS INVESTORS
[Chart courtesy of MarketWatch.com]
  1. Moving the Markets

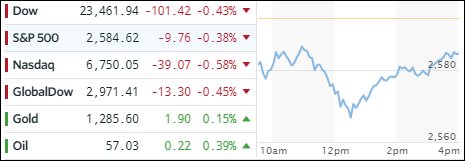
Follow through declines from yesterday’s pullback were rebuffed early on when a slow crawl towards the unchanged line ensued. However, only the Nasdaq was able to muster enough momentum to barely close in the green. The Dow and S&P 500 just fell short thereby registering their first weekly loss in the last nine weeks.

The main worry continued to be the new tax draft bill released by the Senate Finance Committee yesterday, which differed from the House Republican’s plan in that it proposed to delay the cut in corporate taxes until 2019, rather than next year.

Obviously, there will be many discussions coming up before the final vote, but hope has been dwindling that a bill will be passed before Thanksgiving or even Christmas. In other words, Wall Street traders are running out of patience, as the much anticipated economic boost, which has formed the basis of this rally, can’t be counted on in the near future.

In ETF land, the picture was mixed with advancers and decliners just about cancelling each other out. Semiconductors (SMH) picked up the leadership again by adding +0.58%, which was followed by MidCaps (SCHM) with +0.18%. Closing in the red was Aerospace & Defense (ITA) along with Emerging Markets (SCHE) with -0.53% and -0.43% respectively.

Interest rates rose sharply with the yield on the 10-year bond jumping 7 basis points to 2.40%. That was not good news for the 20-year bond (TLT), whose price gapped lower and dove by -1.51%. The US dollar meandered and gave back a tiny -0.08% for the session but lost -0.61% for the week.

Read More

Weekly StatSheet For The ETF Tracker Newsletter – Updated Through 11/09/2017

Ulli ETF StatSheet Contact

ETF Data updated through Thursday, November 9, 2017

Methodology/Use of this StatSheet:

  1. From the universe of over 1,800 ETFs, I have selected only those with a trading volume of over $5 million per day (HV ETFs), so that liquidity and a small bid/ask spread are assured.
  2. Trend Tracking Indexes (TTIs)

Buy or Sell decisions for Domestic and International ETFs (section 1 and 2), are made based on the respective TTI and its position either above or below its long-term M/A (Moving Average). A crossing of the trend line from below accompanied by some staying power above constitutes a “Buy” signal. Conversely, a clear break below the line constitutes a “Sell” signal. Additionally, I use a 7.5% trailing stop loss on all positions in these categories to control downside risk.

  1. All other investment arenas do not have a TTI and should be traded based on the position of the individual ETF relative to its own respective trend line (%M/A). That’s why those signals are referred to as a “Selective Buy.” In other words, if an ETF crosses its own trendline to the upside, a “Buy” signal is generated. Since these areas tend to be more volatile, I recommend a wider trailing sell stop of 7.5% -10% depending on your risk tolerance.

If you are unfamiliar with some of the terminology, please see Glossary of Terms and new subscriber information in section 9.


  1. DOMESTIC EQUITY ETFs: BUY — since 4/4/2016

Click on chart to enlarge

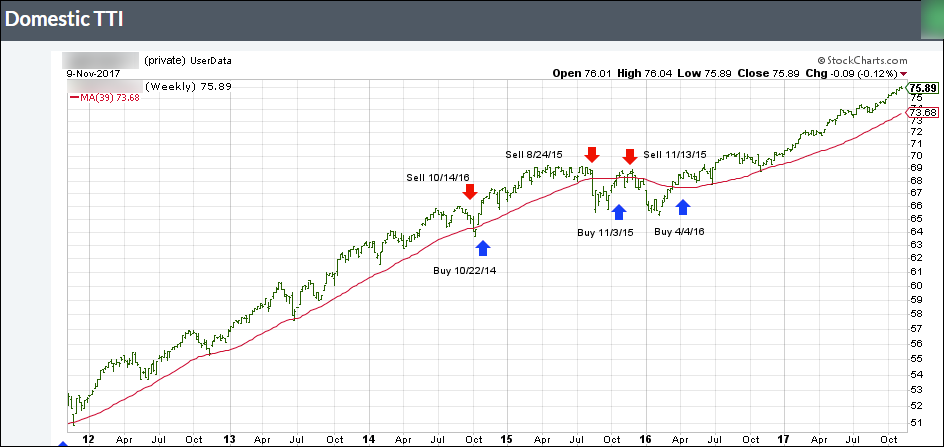
Our main directional indicator, the Domestic Trend Tracking Index (TTI-green line in the above chart) is positioned above its long-term trend line (red) by +3.16% after having generated a new Domestic Buy signal effective 4/4/2016 as posted.

Read More

Snapping The Winning Streak

Ulli Market Commentary Contact

[Chart courtesy of MarketWatch.com]
  1. Moving the Markets

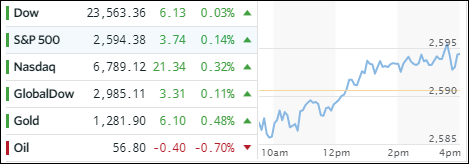
The Dow’s seven-day win streak came to an end today, as technology and industrials took the brunt of the sell-off, the negative effects of which were greatly reduced thanks to the afternoon rebound. However, worries about a possible delay in the implementation of the corporate tax cut plan by one year proved to be too bearish of an influence for the indexes to conquer the unchanged line. In the end, equities had their worst session in two weeks.

The ETFs space was not immune from today’s pullback, as green numbers were noticeably absent. To no surprise, the biggest gainer of the year, Semiconductors (SMH), led the downside leaders with -1.95% followed by Aerospace & Defense (ITA) with -1.48%. Holding up best were Financials (XLF) with -0.34%.

Bond yields rose with the 10-year adding 1 basis point to end at 2.33%. However, the carnage in High Yield debt continued with HYG gapping down and losing another -0.49%. It’s now honing in on breaking its 200-day M/A, which could be an early indicator that higher interest rates may be on their way. The US dollar (UUP) followed suit (-0.41%) and tumbled to its lowest point since late October.

Read More

Carving Out New Highs

Ulli Market Commentary Contact

[Chart courtesy of MarketWatch.com]
  1. Moving the Markets

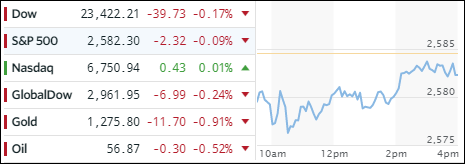
It appears that we’re back to normal—the new normal that is. I am talking about the pattern we’ve come to know very well this year. Namely, a weak opening followed by a mid-day bounce and a strong finish accompanied by new all-time highs. That’s exactly what we got, as the major indexes scored simultaneous records on the same day for the 27th time this year.

Hope prevailed that market fundamentals are justified (they’re not), the economy is expanding (very questionable if you look at record retail store closings) and that Trump will deliver on his tax cuts (no assurances). However, none of these concerns matter as long as there is hope, the markets will take that as a positive. However, just in case that wasn’t enough, the VIX was crushed below 10 again to ensure a green closing.

In ETF space, we saw mainly green numbers. Leading the pack was Emerging Markets (SCHE) with +0.51% joined by International SmallCaps (SCHC) and International Equities (SCHF) with gains of +0.36% and +0.35% respectively. Financials (XLF) headed south by giving back -0.49% along with Transportations (IYT) losing -0.39%.

Interest rates were unchanged but High Yield bonds (HYG) continued to slump by not only losing another -0.44% but also hovering now below their 50-day M/A. We’ll have to wait and see if this is just an outlier or a precursor of things to come in regards to higher rates.

Read More