- Moving the Markets
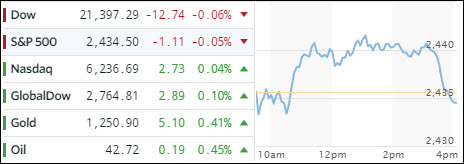
It was another session that ended in a mixed close with the major indexes giving up their hard fought mid-day gains, as they slumped into the close with only the S&P 500 showing a tiny gain of +0.04%. SmallCaps did better as both, domestic and international ones, managed to eke out +0.38% and +0.27% respectively.
Healthcare (XLV) saved the day and continued its winning ways of the past 4 days by adding another +1.04%, which was largely offset in the indexes by the Financials/Banks with the Regional Banking ETF (KRE) surrendering -0.67% while GS gave back -1.22%.
Interest rates slipped after one of the Fed’s mouthpieces (Bullard) uttered in an interview that “the Fed’s projected rate path may be too aggressive.” That helped the S&P to climb out of the red early on, but it was not enough to keep the momentum going. But, the 10-year bond yield slipped to settle at 2.15%.
Crude oil finally managed a rebound joined by the retailers with XRT closing up +0.59%, which looked more like a dead cat bounce than the beginning of a meaningful reversal. The US dollar meandered aimlessly with UUP closing up a tiny +0.04%.