- Moving the Markets
A host of events joined forces to keep equities in a state of uncertainty. It started with an ugly jobs data report showing that jobless claims spiked the most in 12 years, in part due to hurricane Harvey’s economic effects many of which are still unknown. Not helping matters was the announcement that Q2 saw labor costs decline -0.2% YoY, meaning they have been unchanged since 2015 and income gains are simply an illusion.
Financials (XLF) got hit hard today and lost -1.73% with the Regional Banking ETF (KBWR) dropping -2.62%. On the equity side, we saw the International SmallCaps (SCHC) take top billing with +1.08% followed by the Internationals (SCHF) with +0.80%. Ending the day in the red were domestic SmallCaps (SCHA) with a modest -0.28% loss.
With all of the official rhetoric spewed in MSM as to how great the economy is doing, I have to ask: If that is so, why are interest rates collapsing? They should be rising instead. The 10-year Bond yield slipped again by 5 basis points to end the day at 2.05%; which is the lowest level of the year. It looks as though the 2% level may be taken out in the near future to bring us back to where we were at election time. In other words, the Trump pump effect on interest rates has been wiped out. Will equities follow?
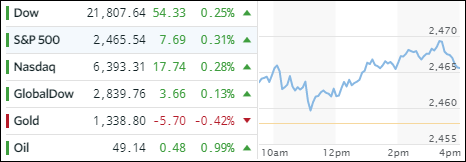
The US Dollar (UUP) plunged by -1.33% and has not only been making a new low for the year but also reached a point last seen in December 2014. It has clearly broken its 200-day M/A to the downside and is stuck in bear market territory. On the plus side, gold is heading solidly north and has conquered its $1,350 marker for the first time since July 2016.