Fed Head Saves The Day

Ulli Market Commentary Contact

[Chart courtesy of MarketWatch.com]
  1. Moving the markets

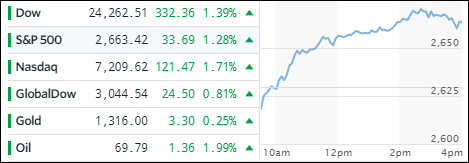
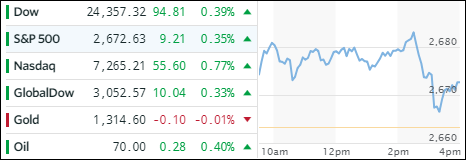
The major indexes slipped right after the opening bell and remained below their respective unchanged lines for most of the day but ended up crawling into the green to close with modest gains. Saving the day was new Fed Head Jay Powel after uttering words like financial stability, which was music to the ears of the traders to leave the early bearish mind set.

Nevertheless, activity was subdued ahead of tomorrow’s key inflation reading on January’s CPI. Traders are worried that a “hotter” than expected number could create another sell-off with higher prices causing the Fed to hike rates at a faster pace to control inflationary forces. That would spike volatility and could lead to a repeat of last week’s negative effect   on equities.

Not helping matters was Trump’s proposed $4.4 trillion federal budget, which would just about see the current deficit (2017) double and in the next year and climb some $7 trillion over the next decade, which for sure will have Treasury yields jump as higher interest rates are baked in the cake.

However, today, bond yields pulled back slightly with the 10-year dropping 3 basis points to end at 2.83%. The US Dollar (UUP), which rebounded off its lows last week, returned to its bearish trend by losing -0.55%.

Read More

Bargain Hunting

Ulli Market Commentary Contact

[Chart courtesy of MarketWatch.com]
  1. Moving the markets

Volatility continued today although not much was visible during the regular session. ZH remarked:

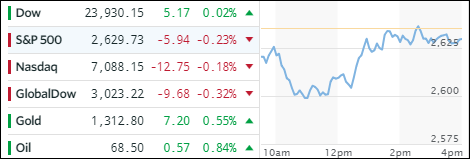
Having been up almost 400 points from its Friday cash close, Dow futures plunged back into the red, amid chaotic swings and the lowest market liquidity ever seen. But that did not last as the machines dragged stocks back up – The Dow up over 500 points to a 50% retrace of its Volocaust losses… before running out of steam…

In other words, we are still in the middle of chaotic conditions where anything can happen as witnessed by the “Fear-and-Greed” index whose needle remains stuck at “Extreme Fear.” It will take a little time to evaluate if the VIX is just taking a break to come back with a vengeance or if today’s upside follow through signals an end to the correction.

Markets headed higher supported by declining bond yields and a weaker dollar. The execution of our trailing sell stops last Friday affected about 55% of our ETF holdings, and we are participating in the current rally with the remaining 45%. I will increase those percentages as soon as I see some calmness return to the markets, which also likely means that bond yields will need to stop rising.

That was not the case today as the 10-year rose 3 basis points to 2.86% with inflation worries being on the forefront. In that regard, traders are eagerly awaiting Wednesday’s Consumer Price Index (for January), which is critical, as a higher than expected number will represent further inflationary tendencies, followed by higher interest rates and potentially a bearish effect on equities.

Read More

ETFs On The Cutline – Updated Through 02/09/2018

Ulli ETFs on the Cutline Contact

Below please find the latest High Volume ETFs Cutline report, which shows how far above or below their respective long-term trend lines (39 week SMA) my currently tracked ETFs are positioned.

This report covers the HV ETF Master List from Thursday’s StatSheet and includes 366 High Volume ETFs ETFs, defined as those with an average daily volume of more than $5 million, of which currently 173 (last week 232) are hovering in bullish territory. The yellow line separates those ETFs that are positioned above their trend line (%M/A) from those that have dropped below it.

Take a look:

The HV ETF Master Cutline Report

In case you are not familiar with some of the terminology used in the reports, please read the Glossary of Terms.

If you missed the original post about the Cutline approach, you can read it here.

ETF Tracker Newsletter For February 9, 2018

Ulli ETF Tracker Contact

ETF Tracker StatSheet

https://theetfbully.com/2018/02/weekly-statsheet-etf-tracker-newsletter-updated-02-08-2018/

 RIDING THE ROLLER COASTER—AGAIN

[Chart courtesy of MarketWatch.com]
  1. Moving the markets

The session started out with an early bounce that slowly but surely deteriorated, but some mysterious buyers stepped in late in the day to push the indexes back above their unchanged lines. It must have been bottom fishers, as the S&P 500 had just broken its 200-day M/A to the downside. Still, for the week, the markets posted their largest weekly drop since early 2016. The current chaos was spread widely with equity flows recording their biggest swing ever: Record inflow 2 weeks ago to record outflow from equity funds this week.

As the markets were starting to look dicey mid-day, I took the opportunity to liquidate those holdings (locking in a profit) that were on my list after having broken through their trailing sell stops. In my mind, there are only 3 things that can happen now:

  1. The markets continue to be chaotic and work their way lower by pushing our Trend Tracking Indexes into bear market territory. Should that happen, our sell stop exit strategy got us out in time before things got worse.
  2. The markets are indecisive and volatile and establish a sideways pattern with no clear direction in sight. However, eventually a break out, either up or down, will occur.
  3. The markets are finding a bottom here, and the major indexes resume their upward trend towards their old highs. In this case, the liquidation of our ETFs generated by our sell stop strategy was false and/or premature, and I will have erred on the side of caution. Having seen my share of market disasters over the past 30 years, I’d rather be a day early than a day late.

We will now have to wait and see if our remaining positions will get stopped out and if my 3 scenarios will start to play out next week.

Read More

Weekly StatSheet For The ETF Tracker Newsletter – Updated Through 02/08/2018

Ulli ETF StatSheet Contact

ETF Data updated through Thursday, February 8, 2018

Methodology/Use of this StatSheet:

  1. From the universe of over 1,800 ETFs, I have selected only those with a trading volume of over $5 million per day (HV ETFs), so that liquidity and a small bid/ask spread are assured.
  2. Trend Tracking Indexes (TTIs)

Buy or Sell decisions for Domestic and International ETFs (section 1 and 2), are made based on the respective TTI and its position either above or below its long-term M/A (Moving Average). A crossing of the trend line from below accompanied by some staying power above constitutes a “Buy” signal. Conversely, a clear break below the line constitutes a “Sell” signal. Additionally, I use a 7.5% trailing stop loss on all positions in these categories to control downside risk.

  1. All other investment arenas do not have a TTI and should be traded based on the position of the individual ETF relative to its own respective trend line (%M/A). That’s why those signals are referred to as a “Selective Buy.” In other words, if an ETF crosses its own trendline to the upside, a “Buy” signal is generated. Since these areas tend to be more volatile, I recommend a wider trailing sell stop of 7.5% -10% depending on your risk tolerance.

If you are unfamiliar with some of the terminology, please see Glossary of Terms and new subscriber information in section 9.


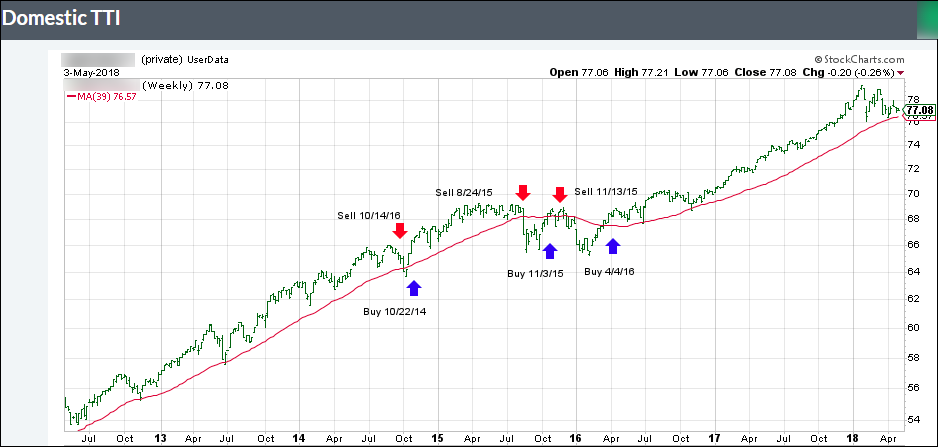
  1. DOMESTIC EQUITY ETFs: BUY — since 4/4/2016

Click on chart to enlarge

Our main directional indicator, the Domestic Trend Tracking Index (TTI-green line in the above chart) is positioned above its long-term trend line (red) by +1.00% after having generated a new Domestic Buy signal effective 4/4/2016 as posted.

Read More

Market Dominators: Volatility And Rising Bond Yields; Dow Enters Correction; TTIs Barely Remain In Bullish Territory

Ulli Market Commentary Contact

[Chart courtesy of MarketWatch.com]
  1. Moving the markets

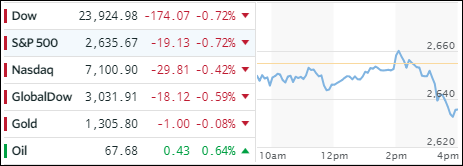
As I mentioned yesterday, volatility (VIX above 35) and rising bond yields, which spiked during a weak auction and spooked equities, combined to give the bears the upper hand as the major indexes fell off a cliff with the Dow entering correction territory. ZH summed it up perfectly:

As a reminder, the ‘good’ news of a budget deal and no government shutdown means higher deficits and more Treasury supply, and with The Fed out of the bond-buying game, the search for the marginal buyer continues to push rates higher.

10% Correction Levels:

  1. Dow 23954 – Dow closed at 23860 is in correction
  2. S&P 2585 – S&P closed at 2581 in correction
  3. Nasdaq 6755 – Nasdaq closed at 6777, not in correction

Needless to say, there were no green numbers to be found, and there was no place to hide. The markets may remain volatile, as long as the upward pressure on bond yields does not subside. The 10-year yield rose only 1 basis point to 2.85% but the fear of potentially more upward momentum is what keeps the markets from stabilizing.

Our Trend Tracking Indexes (TTIs) dropped sharply (see section 3) and are barely staying above their respective trend lines. Additionally, most holdings are dancing around their sell stops and will be liquidated tomorrow, unless I see some market stability or a rebound, in which case I will hold off another day. A slip into bear market territory is now a distinct possibility.

Read More