- Moving the markets
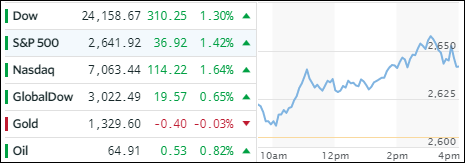
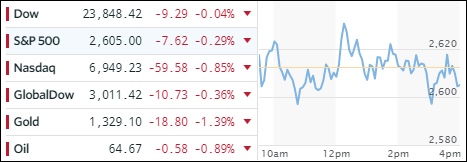
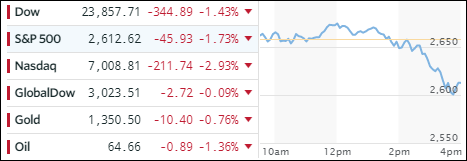
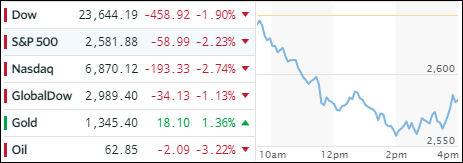
Friday’s month ending bounce-back is now in the rear view mirror as the floodgates opened this morning, and the major indexes headed straight south just about uninterruptedly until they found a support point this afternoon, which softened the damage for the day.
Nevertheless, chart damage was done with the S&P dropping below it’s widely watched 200-day M/A (-0.28%). This is the first time in about 18 months and generally a sign of weakening momentum that could invite further selling unless a quick bounce back recovers that level. That attempt fell short this afternoon.
There was simply no place to hide other than in gold. Tech took the lead down the elevator shaft again with FANGS getting hammered joined by bank stocks. Interest rates dropped with the 10-year bond yield hitting a two-month low at 2.73% while the US Dollar managed a slight rebound.
In terms of our Trend Tracking strategy, one of our trailing sell stops was triggered and will be liquidated tomorrow unless the markets stage a solid turnaround rally. The Domestic TTI has remained on the bullish side of its trend line but only by small margin. The International one has slipped barely below its own trend line, but by not enough of a margin to pull the trigger and declare this “Buy” cycle to be over.
However, we are very close. Should the markets show considerable weakness again tomorrow, I will then consider the International “Sell” to be validated and liquidate the appropriate holdings.
For details, please see section 3 below.