ETF Tracker StatSheet
THE WORST THANKSGIVING WEEK IN 7 YEARS
- Moving the markets
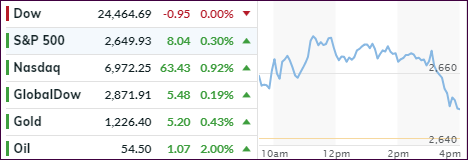
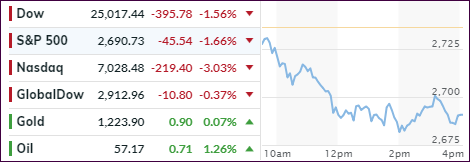
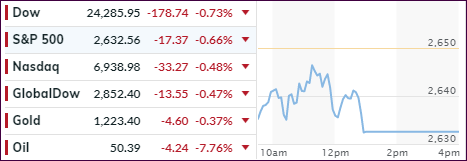
Despite an early rally attempt based on hope that “black Friday” would do wonders for the retail sector, the gains could not be sustained, and the major indexes plunged into the close during this Holiday shortened session.
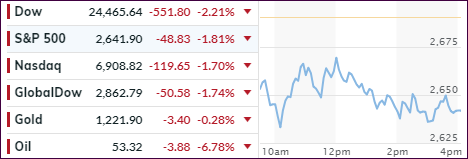
In the end, things continued to look bleak for the bulls with the indexes scoring their worst Thanksgiving week since 2011. How bad was it? The Nasdaq tumbled -4.3%, the Dow slipped -4.4% and the S&P 500 turned out to be the “winner” by “only” losing -3.8%. That is down 10% from its record closing high and confirms that is now in correction territory.
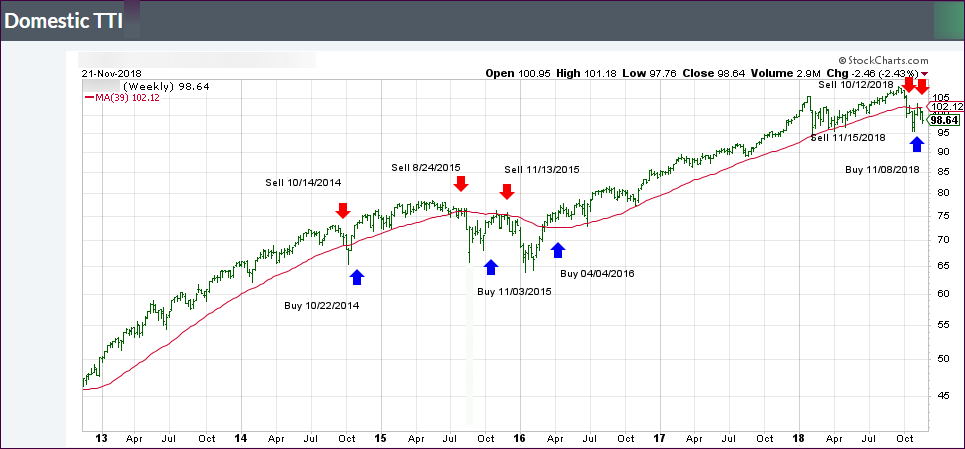
Crude oil (WTI) took top billing again by crashing almost -8% to a 10-year low and is barely hanging on to a $50 handle. Sure, much of the headlines talk about supply worries ahead of an upcoming OPEC meeting, but to me the real reason is simply a slowdown in global growth activity. That is why our International Trend Tracking Index (TTI) has been in bear market territory since 10/11/2018. Bear markets are a result of economic slowdowns.
This chart, hat tip goes to ZH, demonstrates that “soft” survey data is starting to catch down to the “hard” reality of economic data. If this continues, we’ll sure be welcoming the S&P 500 to bear market territory soon (another 10% drop).
It’s good to be on the sidelines.