
- Moving the markets
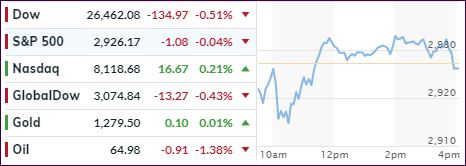
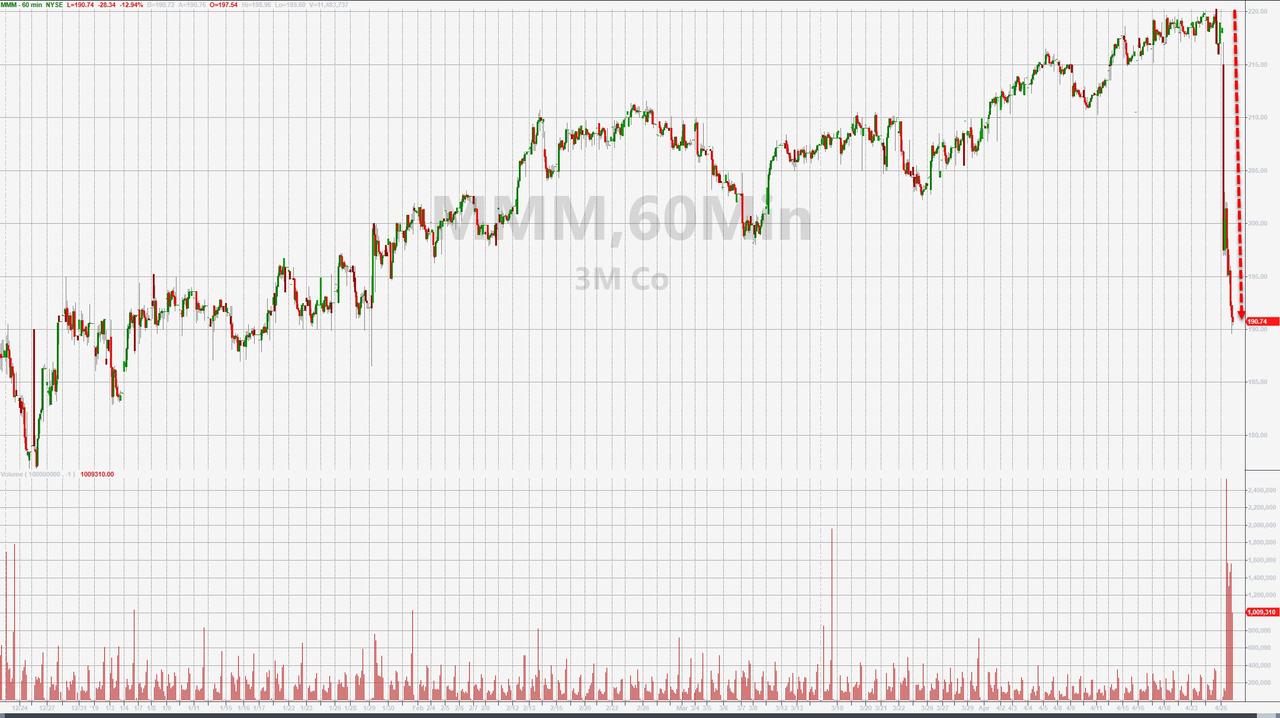
The markets came under pressure this morning with the Dow dropping some 250 points right at the opening. 3M was the contributor to this downside move as earnings disappointed, but more importantly, the company slashed forward guidance for 2019 and reduced its workforce by 2,000. The punishment was immediate with the stock skidding some 13%, its worst day since 1987’s Black Monday.
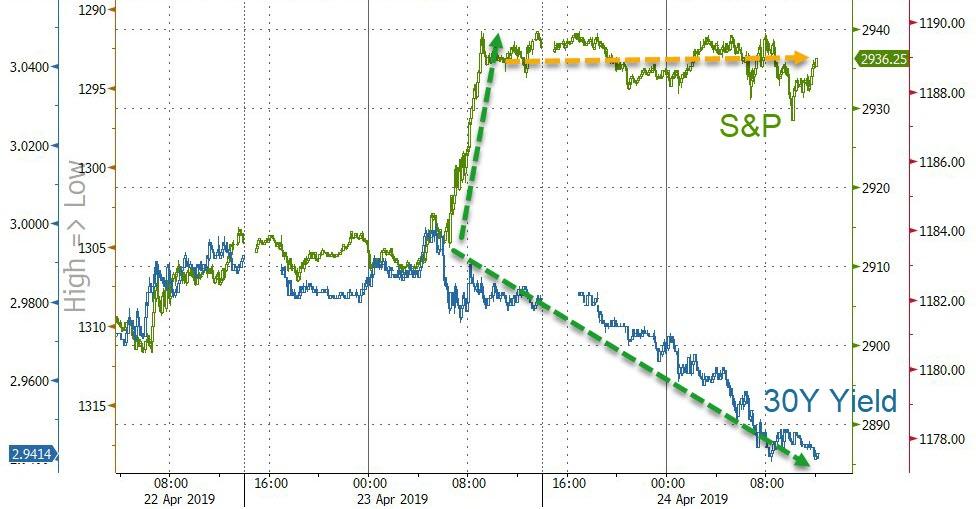
While the Dow bounced back, thanks to dip-buying rescuers, the index fared the worst of the 3 major ones by losing -0.51%. The Nasdaq closed slightly in the green, and the S&P hugged its unchanged line throughout the day but gave back a fraction in the end.
While we’ve seen a decent advance in equities this week, there are mounting signs of economic weakness throughout the world, ranging from Europe to Australia where rate cut expectations have increased. The Bank of Canada and the Bank of Japan are both projected to assume a more dovish stance (lower rates) in preparation of combating a further slowing of economic activity.
Domestically, we saw initial jobless claims surge the most in 18 months, thereby wiping out the drop we saw over the past 5 weeks. Does that mean we are now seeing the “real” and not seasonally adjusted economy appear on the horizon?
Again, bond yields ticked down causing a more favorable close to the low volatility SPLV vs. its more aggressive cousin SPY. See yesterday’s post for details.
