Below, please find the latest High-Volume ETF Cutline
report, which shows how far above or below their respective long-term trend
lines (39-week SMA) my currently tracked ETFs are positioned.
This report covers the HV ETF Master List from Thursday’s
StatSheet and includes 322 High Volume ETFs, defined as those with an average
daily volume of more than $5 million, of which currently 272 (last week 278)
are hovering in bullish territory. The yellow line separates those ETFs that
are positioned above their trend line (%M/A) from those that have dropped below
it.
In case you are not familiar
with some of the terminology used in the reports, please read the Glossary of Terms.
If you missed the original
post about the Cutline approach, you can read it here.
Yesterday’s
extremely dovish words by the Fed’s mouthpiece Williams seem to have struck
some raw nerves, as the Fed tried to walk back the “communications debacle.” It
was like putting the toothpaste back in the tube, as William’s viewpoint raised
market expectations to an upcoming 0.5% rate cut as opposed to a potential
0.25% reduction.
This
kind of head fake caused the NY Fed to subsequently release a statement stating
that “President William’s speech on Thursday afternoon was not intended to
send a signal that the Fed might make a
large interest rate cut but rather is was ‘an academic speech on 20 years of
research.’”
Of
course, the markets reacted positively yesterday, but today’s reality check pulled
the major indexes off their early session highs and sent them south with all
three of them not only closing in the red but also at the lows for the day. Summing
it up, the Fed better deliver a 0.25% rate cut, or equities will head south in
a big way.
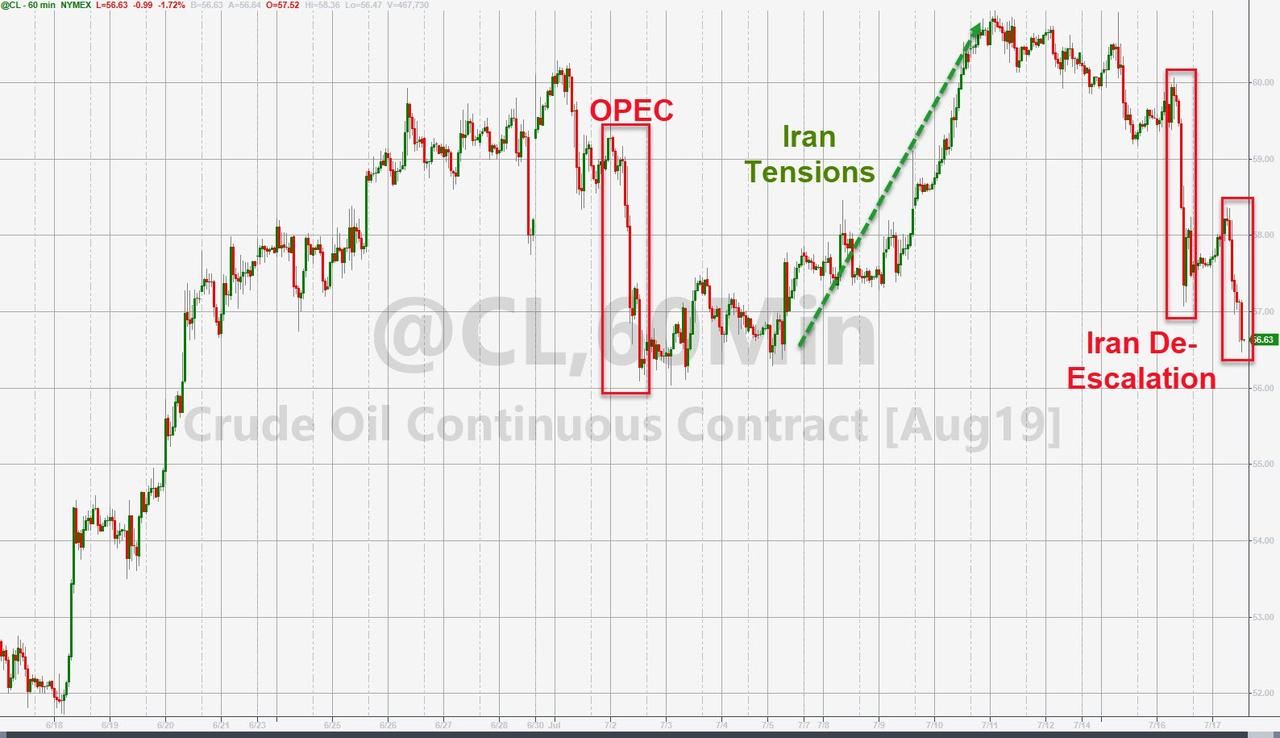
Tensions
in the Middle East ratcheted up a notch, as a drone was downed, and an oil tanker
was hijacked, which had traders is a sour mood adding to the overall negativity
in the marketplace.
While
bond yields tumbled for the week, they did spike today, thereby negatively
affecting bond prices, as well as low volatility ETFs, such as SPLV.
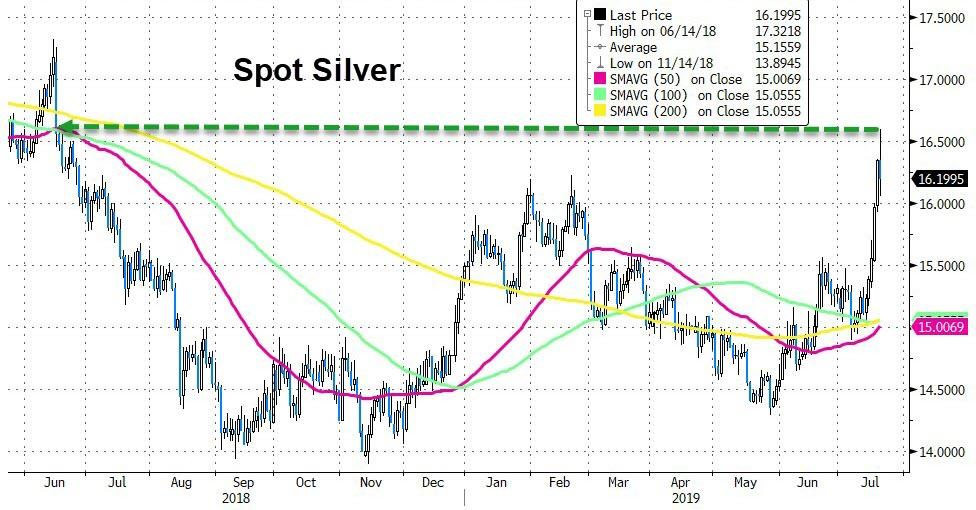
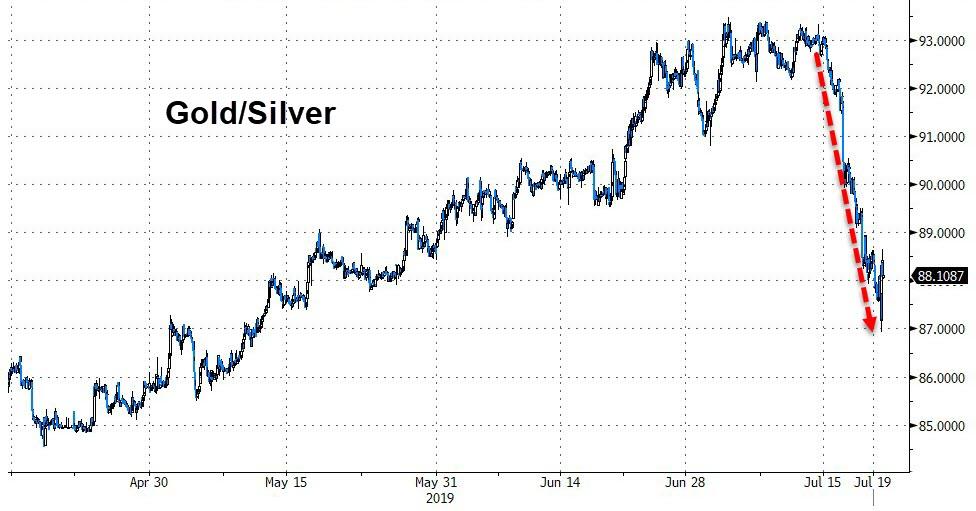
Benefiting
from all this turmoil was the long-forgotten metal, namely silver. It soared
over 6% for the week and is back above $16. This was silver’s biggest weekly
gain since July 2016, and it improved its ratio with gold considerably, as the chart
shows.
While
all eyes are on the Fed, they will not issue their verdict on interest rates
until July 31, which means we have another 1.5 weeks to put up with the seemingly
endless jawboning as to why they should or should not pull the trigger.
1. From the universe of over 1,800 ETFs, I have selected only those with a
trading volume of over $5 million per day (HV ETFs), so that liquidity and a
small bid/ask spread are assured.
2. Trend Tracking Indexes (TTIs)
Buy or Sell decisions for Domestic and International ETFs (section 1 and
2), are made based on the respective TTI and its position either above or below
its long-term M/A (Moving Average). A crossing of the trend line from below
accompanied by some staying power above constitutes a “Buy” signal. Conversely,
a clear break below the line constitutes a “Sell” signal. Additionally, I use a
7.5% trailing stop loss on all positions in these categories to control
downside risk.
3. All other investment arenas do not have a TTI and should be traded
based on the position of the individual
ETF relative to its own respective trend line (%M/A). That’s why those signals
are referred to as a “Selective Buy.” In other words, if an ETF crosses its own
trendline to the upside, a “Buy” signal is generated. Since these areas tend to
be more volatile, I recommend a wider trailing sell stop of 7.5% -10% depending
on your risk tolerance.
If you are unfamiliar with some of the terminology, please see Glossary of Termsand new subscriber information in section 9.
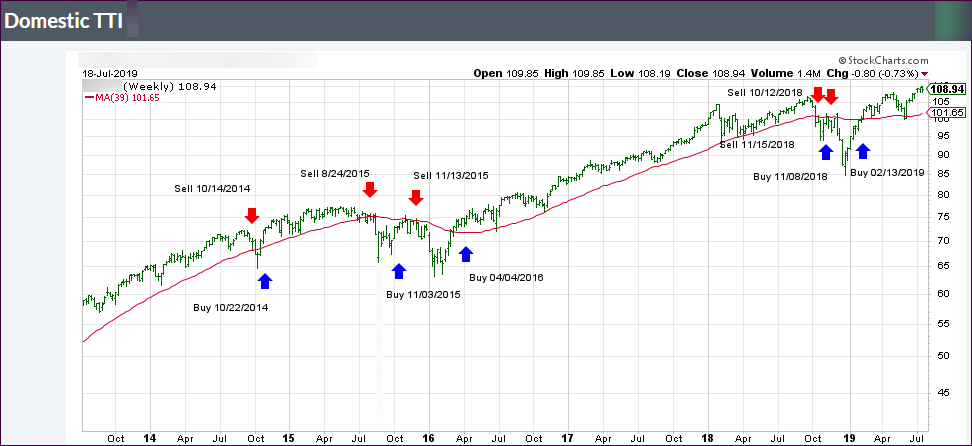
1. DOMESTIC EQUITY ETFs: BUY
— since 02/13/2019
Click on chart to enlarge
Our main directional indicator, the Domestic Trend Tracking Index (TTI-green line in the above chart) is now positioned above its long-term trend line (red) by +7.44% after having generated a new Domestic “Buy” signal effective 2/13/19 as posted.
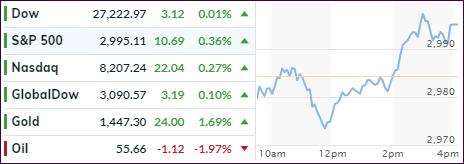
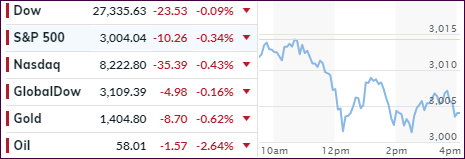
Yesterday, the markets closed on a sour note by scoring
their lows for session in the final seconds of trading. That usually does not
bode well for the next day’s opening, and today was no exception.
The major indexes slipped early on but managed to rebound
by mid-day with fresh upward momentum pushing equities into the green, caused
by the Fed’s Williams opining that:
“interest rates should be cut as insurance against an
economic downturn,”
And
“when you have only
so much stimulus at your disposal, it pays to act quickly to lower rates at the
first sign of economic distress.”
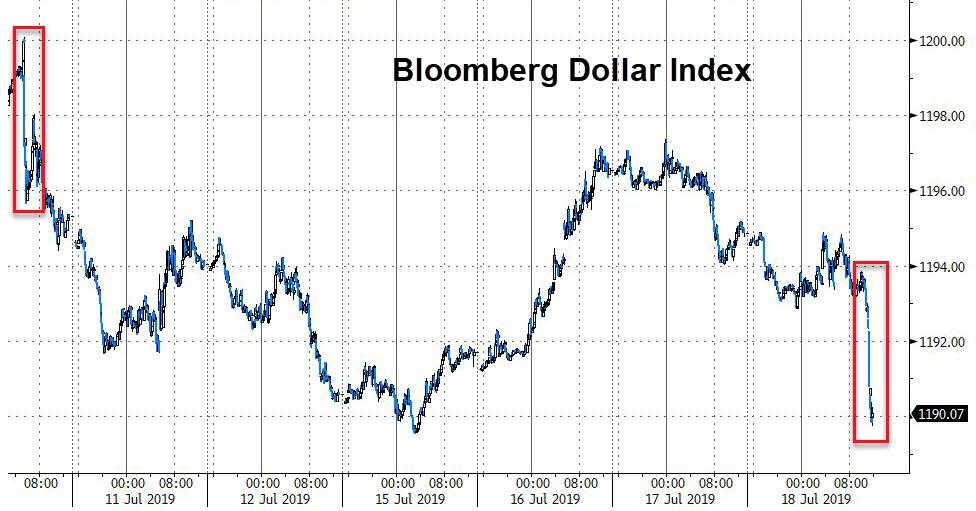
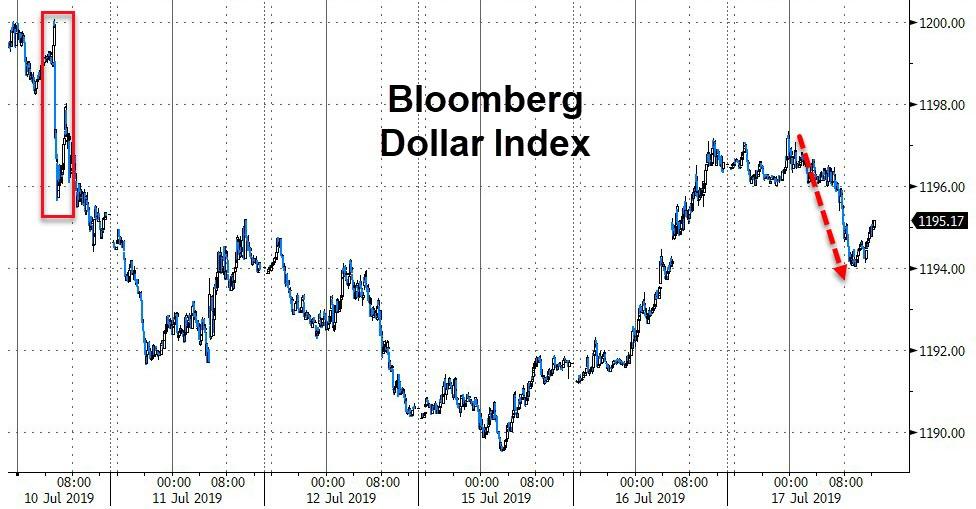
That pretty much saved the day for stocks but took the starch
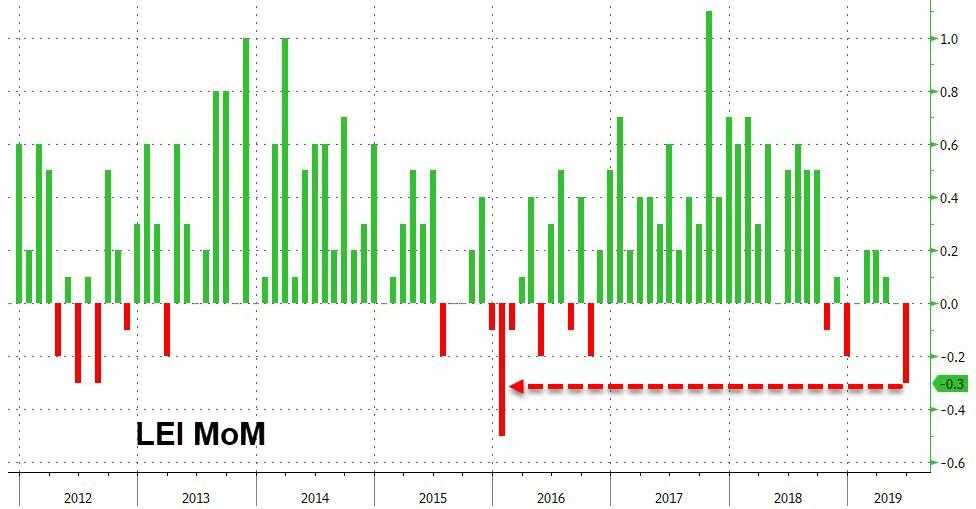
out of the US
dollar, as the latest Leading Indicators headline did not help matters. They
slumped the most in over 40 months by tumbling -0.3% in June, which was their
biggest MoM
drop since early 2016.
Then the WSJ reported that trade-deal negotiations
between the U.S. and China had hit a snag (what else is new?) raising doubts
about whether the warring parties can ever reconcile their differences.
On the earnings front, things were mixed at best with
Netflix being the loser of the day by surrendering almost -11%. This was due to
a bad miss on expectations for new paying subscribers.
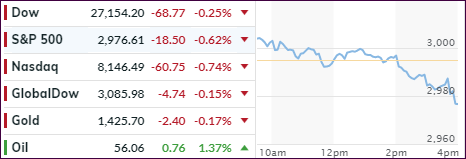
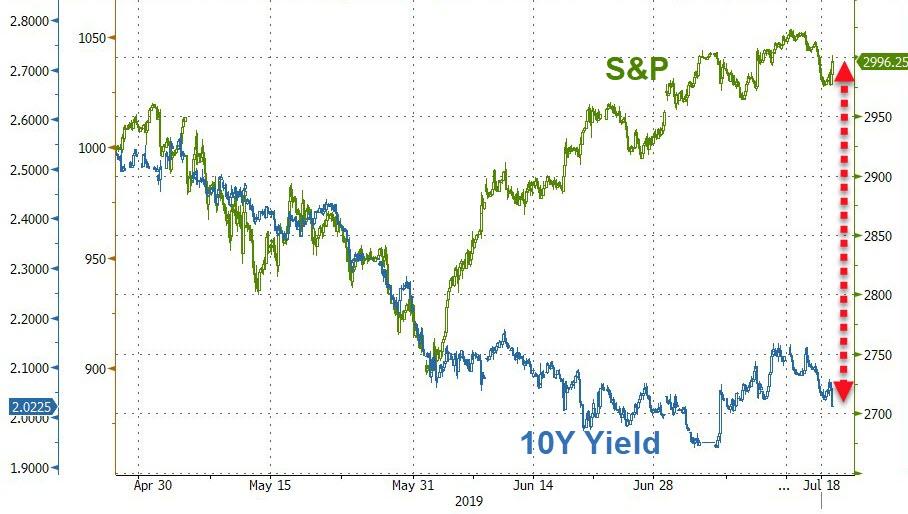
In the end, the S&P 500 failed to reclaim its recently
lost 3k marker, while the Dow barely held on to a green close. The decoupling
between the S&P 500 and the 10-year yield continues uncompromisingly, the latter
of which has been now trending
back towards the 2% level.
There was not much motivation on the part of the bulls to
engage and keep this market from fizzling. The big three, namely lack of progress
on the trade dispute with China, mixed earnings results and weak headlines for economic
numbers, combined to create a lackluster session.
In other words, the recently observed last 30-minute pump
was only a distant memory causing the major indexes, who spent most of the day
below their unchanged lines, to dive into the close. The losses were moderate, given
the recent relentless push into record territory, but it appeared that we
simply ran out of steam.
Not helping matters were Building Permits, which plummeted
the most in 3 years (-6.1% MoM) putting another nail in the coffin of weak home
sales data and mortgage applications, despite ongoing low interest rates. ZH reported
that Housing Starts followed suit and dropped -0.9% MoM (vs. -0.7% expected).
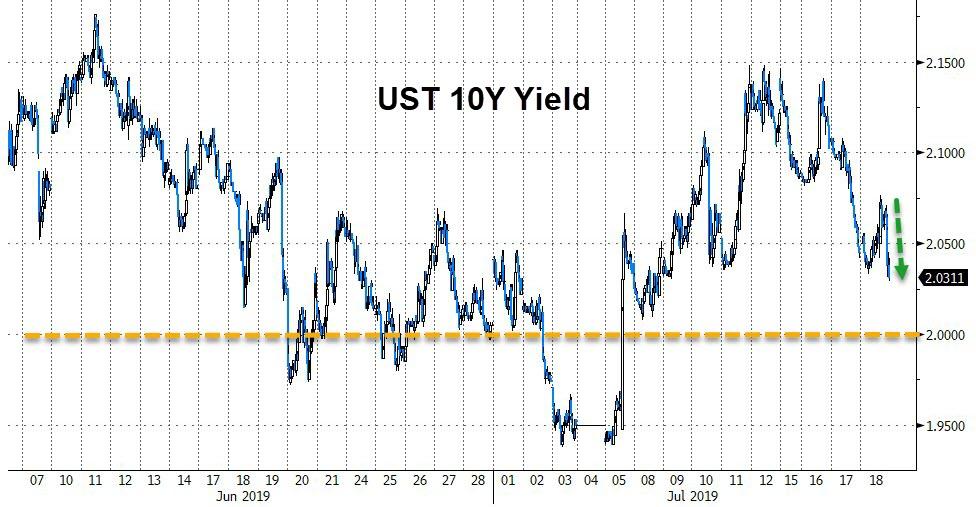
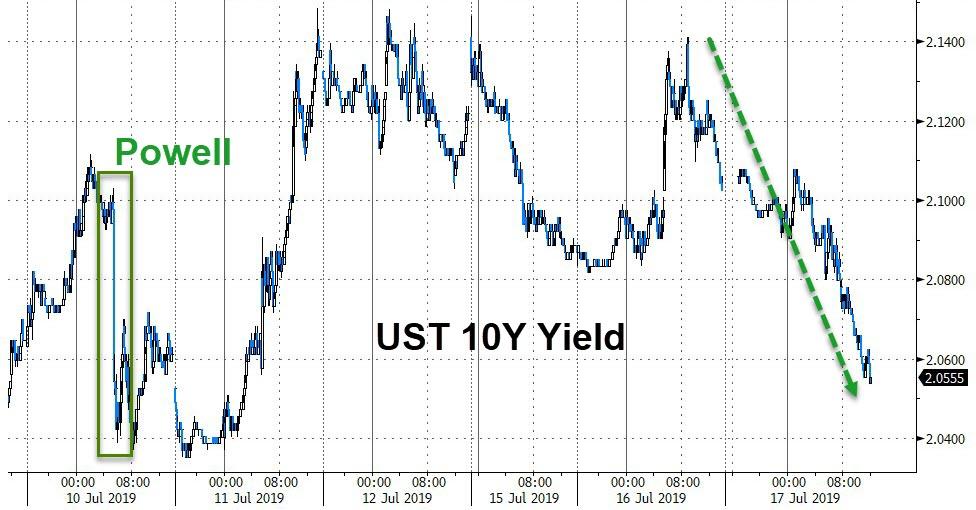
Bond yields headed lower again with the widely held 10-year
having almost made up the losses
sustained in the last week, when we hovered around the 2.14% marker, which is quite
a drop to today’s 2.06%. At the same time, the US
Dollar pulled back, while Oil continued its downward
spiral after a de-escalation of tensions with Iran.
Only about 7% of the S&P 500 companies have reported earnings
so far, so we certainly will have more surprises on deck, any of which can push
the markets in either direction.
It was a tug-of-war between news stories that kept
traders on edge with some headlines causing a sell-off, others creating a recovery,
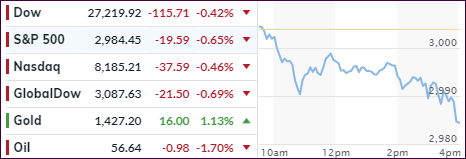
but in the end, the major indexes closed in the red.
We didn’t see the usual last 30-minute rebound due to
Trump’s comments that “trade has a long way to go,” as well as bank earnings,
which painted a mixed picture of the economy and the financial services arena.
Fed chair Powell chimed in from a speech in France that the
“economic outlook hasn’t improved since the last FOMC meeting in June,”
which instilled hope that the stage for an interest rate cut later this month
appears to be set.
This view was crushed a little bit when June retail sales
were released. They exceeded expectations by surging 0.7% MoM, which translates
to 4.6% YoY, the most in 12 months. That ended up being a discouragement for the
low interest rate crowd. After all, if the consumer, which accounts for 67% of
GDP, is spending, why would we need a rate cut?
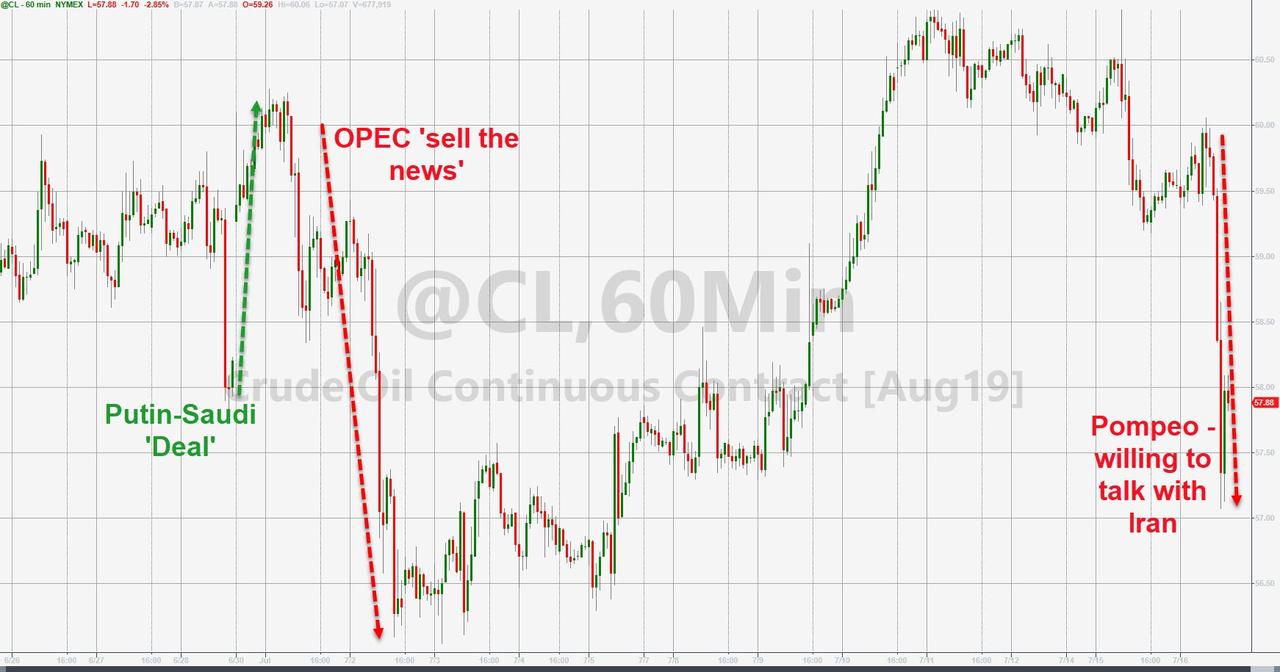
The loser of the day was oil prices, which tanked -2.64%
and had a wild
ride throughout the session, but in the end the administration’s
willingness to “talk to Iran,” took the starch out of the early rally and gave
the bears something to cheer about.
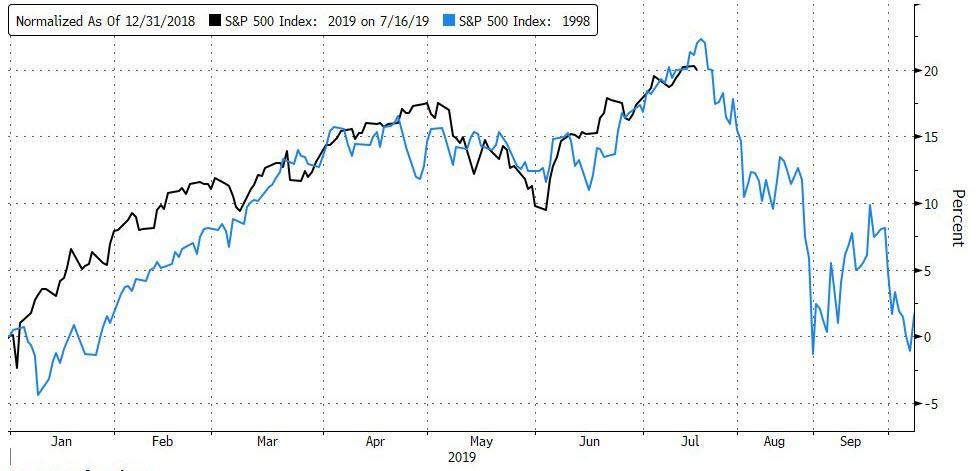
Market behavior today when compared with history may very
well be random and totally meaningless. However, it’s interesting to note the similarities
when looking at the S&P 500 in 2019 compared to 1998. A tip of the hat goes
to ZH for this
chart.
