Chopping Around Key Technical Levels

Ulli Market Commentary Contact

[Chart courtesy of MarketWatch.com]
  1. Moving the markets

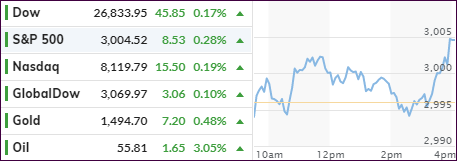
Despite disappointing results from Boeing and Caterpillar, the markets managed an early ramp higher but were not able to sustain it, as a slow deterioration of upward momentum pulled the major indexes back below the unchanged line.

Traders had one eye on the Brexit developments, where the latest parliamentary vote eased concerns about the UK busting out of the EU without a deal by October 31st.

Looking at the big picture, this week is all about earnings with next week’s highlight being the Fed meeting on interest rates. Even though 82.7% of S&P companies have delivered results above expectations, let’s not forget that these expectations have been sharply reduced.

Companies are further justifying these numbers by elaborating that “how we did this quarter isn’t as important as what we expect the future to hold.” Yeah, right.

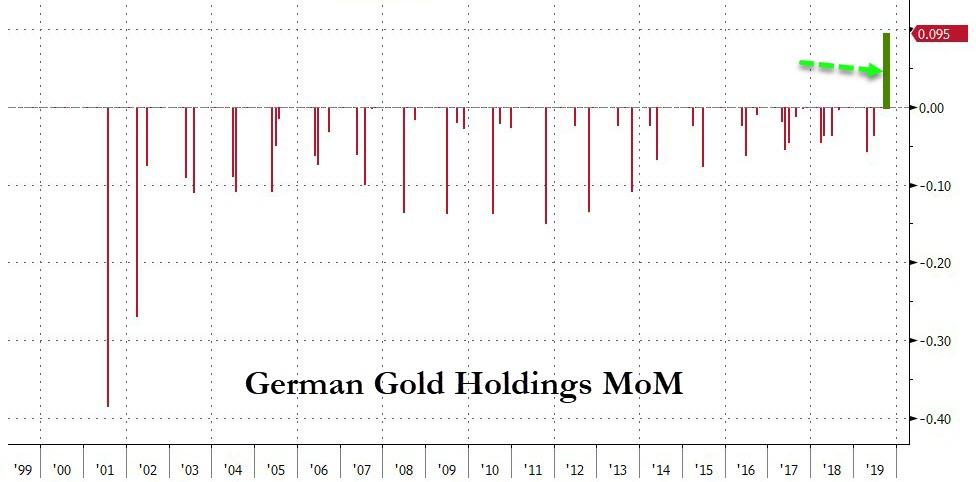
With the Fed’s money printing going into overdrive at the rate of some $60 billion a month, it’s no wonder that Central Banks around the world have been accumulating gold at a record pace. Today, we learned that my home country, Germany, has joined the party by openly buying gold into its reserve holdings—for the first time in 21 years.

That is not surprising, as Germany has more experience with the awful effects of too much money printing than any other industrialized nation. If you are not familiar with that part of history, please read more about the Weimar Republic.

Combining the ECB policies along with Deutsche Bank’s (one of the largest derivatives holders in the world) precipitous demise, fears of a looming financial crises have become a possibility for the Germans and have subsequently caused this renewed interest in gold.

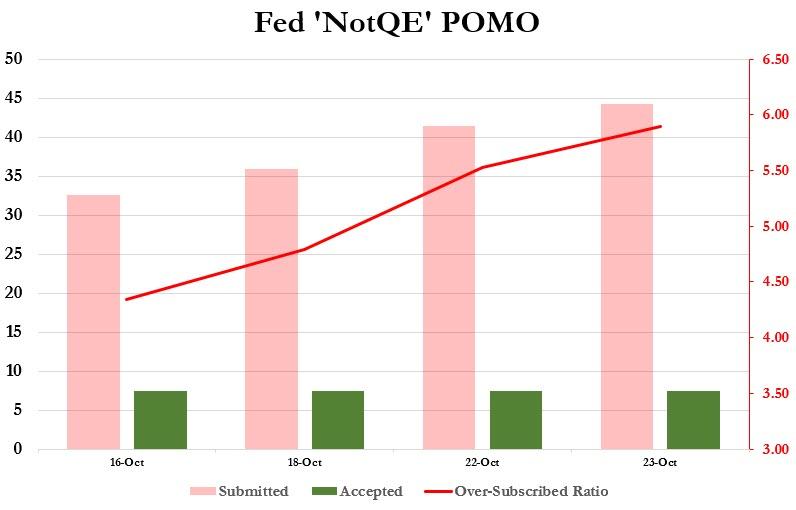
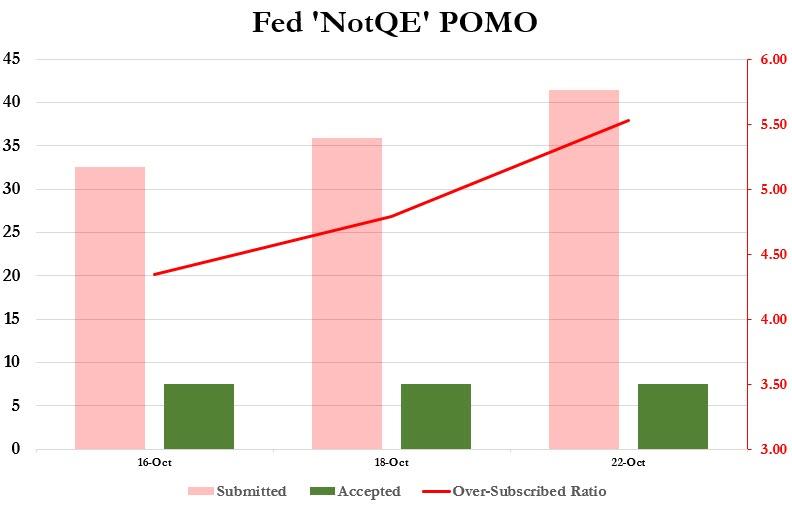
Here in the US, the liquidity scramble in the overnight repo market continues, as the latest operation was oversubscribed 5.9 times. As ZH pointed out, it simply means that the demand for the Fed’s permanent liquidity injection is increasing with every operation.

How long can that go on before we go exponential? And just as important, how long can this go on before equity markets realize that not all is well with the financial plumbing?

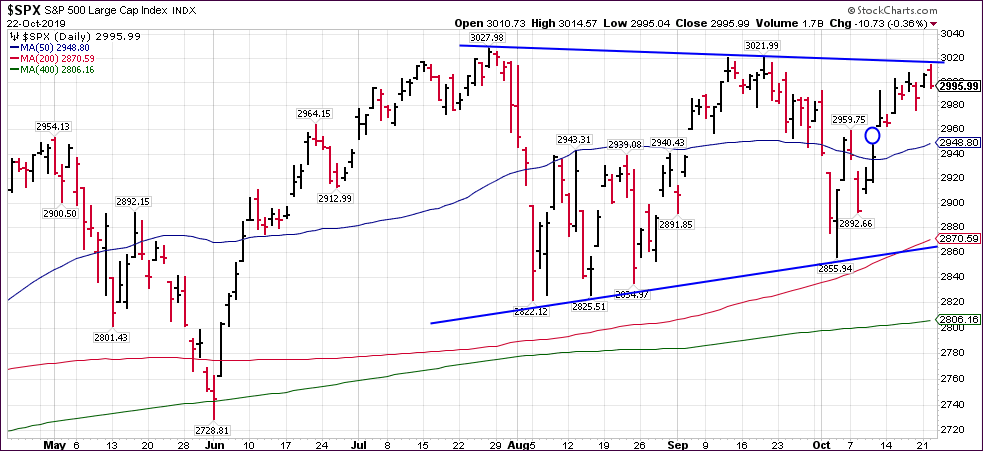
Be that as it may, at least for today, the major indexes moved aimlessly and looked to end up at their respective unchanged lines when a last-minute pump assured a green close.  

Read More

Touching The Glass Ceiling—And Running Out Of Steam

Ulli Market Commentary Contact

[Chart courtesy of MarketWatch.com]
  1. Moving the markets

It sure was a day consisting of mixed reports and, as much as I searched, I could not find a reason that might have supported the early rally. Of course, the latest earnings reports took center stage, but it seemed the disappointing results from McDonalds, Travelers and UPS were overpowering the positive ones.

With the markets failing to break out, after having reached the upper limit of their 3-month trading range, this may change when tech behemoth Amazon releases its results on Thursday. Analysts are looking for “a solid beat” and a subsequent move of the major indexes not just above the current glass ceiling but also into new record-high territory.

With traders’ focus being on a breakout, almost no one talks about far more concerning issues, namely the continued stress, strain and funding squeeze in the overnight lending markets (repos). It’s a very complex issue that boils down to the fact that banks have trouble securing funds due to a shortage in liquidity.

That makes me go hmmm… The Fed announced last week that they will inject funds at a rate of $60 billion per month (but they don’t call it QE) via the purchase of T-Bills, yet today’s repo was oversubscribed 5.5 times. This confirms that participants are scrambling to convert their “safe” assets into dollars as fast as possible, as ZH explains. That leaves this question:

Why are banks still so desperate for liquidity even though the Fed has now made clear the Fed’s balance sheet will expand to accommodate all reserve needs, and why do they so stubbornly refuse to approach the interbank market for their funding needs?

In short, what do they know about the banking system that we don’t?

This monetary crunch, if it continues, may very well get exponentially worse, at which time, there will be no way that the sleepy equity bulls will not have a very rude awakening.

The “smart money” may have already woken up to that fact, if this chart from Bloomberg is any indication.

Read More

Edging Higher; S&P Reclaims The 3,000 Level

Ulli Market Commentary Contact

[Chart courtesy of MarketWatch.com]
  1. Moving the markets

The markets edged higher to start the week with Boeing being a drag on the Dow capping the gains by some 100 points. The S&P 500 managed to finally hold above its 3,000 level but is now homing in on overhead resistance lurking at around 3,020. Then index also has failed to close the breakaway gap (blue circle), which means a retracement will be in order at some time.

However, for right now, the computer algos are chasing headline news and front running any suggestions that Beijing and China have successfully laid the groundwork to solidify a solution to the long-running trade disagreement.

Assisting the bullish theme was another short-squeeze, which helped the indexes to stay in the green and kept the mood upbeat.

In the meantime, the Brexit saga continues full force with UK’s PM Johnson experiencing a setback, which traders liked, since some are of the opinion that a Brexit without a trade agreement could disrupt global markets even further.

On the earnings front, we learned that 75 of the S&P 500 companies have reported with 82.7% showing better-than-expected results. Of course, the bar has been lowered considerably, but when it comes to headlines, a “beat is a beat.” This weak, we have 130 more candidates presenting their report cards, and we will have to see if the above numbers hold up.

On a personal note, I’d like to thank all of you who have emailed and wished me a speedy recovery from my eye surgery last Friday night. It was successful, and I thank you for your kind words.

Read More

ETFs On The Cutline – Updated Through 10/18/2019

Ulli ETFs on the Cutline Contact

Below, please find the latest High-Volume ETF Cutline report, which shows how far above or below their respective long-term trend lines (39-week SMA) my currently tracked ETFs are positioned.

This report covers the HV ETF Master List from Thursday’s StatSheet and includes 322 High Volume ETFs, defined as those with an average daily volume of more than $5 million, of which currently 250 (last week 224) are hovering in bullish territory. The yellow line separates those ETFs that are positioned above their trend line (%M/A) from those that have dropped below it.

Take a look:                                                                   

The HV ETF Master Cutline Report

In case you are not familiar with some of the terminology used in the reports, please read the Glossary of Terms. If you missed the original post about the Cutline approach, you can read it here.      

ETF Tracker Newsletter For October 18, 2019

Ulli ETF Tracker Contact

ETF Tracker StatSheet          

You can view the latest version here.

GLOBAL GROWTH FEARS STOP BULLISH MOMENTUM

[Chart courtesy of MarketWatch.com]
  1. Moving the markets

This is an early and short version of Friday’s commentary, since I will be tied up this afternoon. The markets are still open and will be for another 3.5 hours.

We saw early weakness in part caused by China’s worst GDP growth in 30 years registering 6%. As a result, stocks worldwide pulled back modestly but appear on track to close out the week on the plus side.

Not helping matters was ECB’s Mario Draghi, who will leave office later this month, but couldn’t help himself to issue a warning that he sees “mild signs of over-stretched valuations in markets,” contributing to the early softness in stocks.

Despite relatively upbeat earnings so far, it seems that a fresh stimulus for equities is needed considering slowing Chinese activity and the ever-changing stories about the upcoming Brexit and the US-China trade saga. After all, for the S&P to break through its overhead glass ceiling, I believe it will take more than your hyped news headlines to bring about a push of this bullish trend to new all-time highs.

On a personal note, and the reason for this early release commentary is this. I saw my ophthalmologist a couple of days ago, and he performed an office procedure to fix a partially detached retina. At this time, it appears that it was not successful, and I will have to undergo surgery tonight. The final call will me made this afternoon. I expect to resume posting on Monday again.

Please note that section 2 and 3 below contain yesterday’s data, and I hope to make the update sometime this weekend.

Read More

Weekly StatSheet For The ETF Tracker Newsletter – Updated Through 10/17/2019

Ulli ETF StatSheet Contact

ETF Data updated through Thursday, October 17, 2019

Methodology/Use of this StatSheet:

1. From the universe of over 1,800 ETFs, I have selected only those with a trading volume of over $5 million per day (HV ETFs), so that liquidity and a small bid/ask spread are assured.

2. Trend Tracking Indexes (TTIs)

Buy or Sell decisions for Domestic and International ETFs (section 1 and 2), are made based on the respective TTI and its position either above or below its long-term M/A (Moving Average). A crossing of the trend line from below accompanied by some staying power above constitutes a “Buy” signal. Conversely, a clear break below the line constitutes a “Sell” signal. Additionally, I use a 7.5% trailing stop loss on all positions in these categories to control downside risk.

3. All other investment arenas do not have a TTI and should be traded based on  the position of the individual ETF relative to its own respective trend line (%M/A). That’s why those signals are referred to as a “Selective Buy.” In other words, if an ETF crosses its own trendline to the upside, a “Buy” signal is generated. Since these areas tend to be more volatile, I recommend a wider trailing sell stop of 7.5% -10% depending on your risk tolerance.

If you are unfamiliar with some of the terminology, please see Glossary of Terms and new subscriber information in section 9.     

1. DOMESTIC EQUITY ETFs: BUY — since 02/13/2019

Click on chart to enlarge

Our main directional indicator, the Domestic Trend Tracking Index (TTI-green line in the above chart) is now positioned above its long-term trend line (red) by +3.17% after having generated a new Domestic “Buy” signal effective 2/13/19 as posted.

Read More