
- Moving the market
It was another quiet start for the markets, with traders mostly brushing off worries about the U.S. government shutdown, now in its second day.
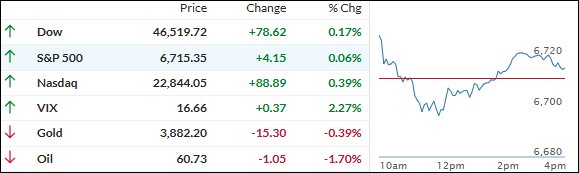
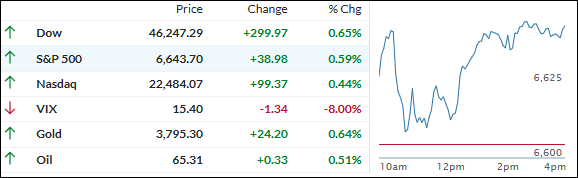
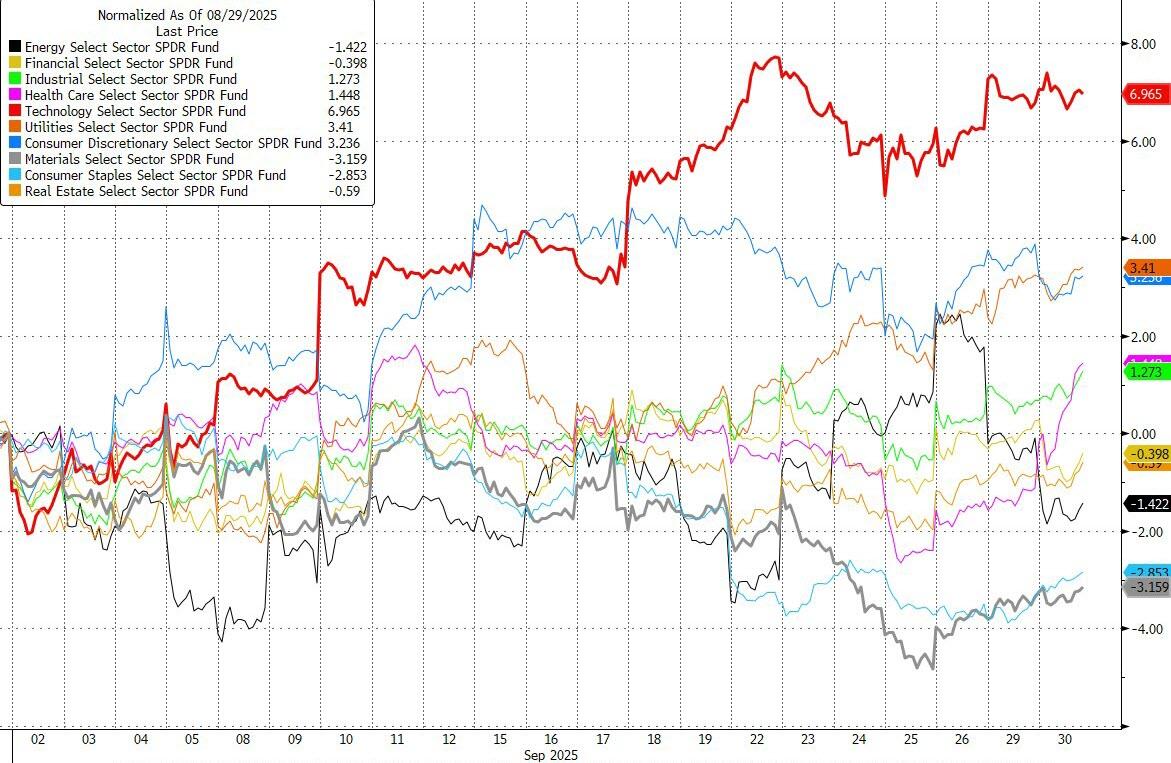
The Nasdaq nudged up 0.39%, hitting a fresh intraday high thanks to Nvidia, which continues to attract heavy investment and reached its own record high.
Yesterday’s gains across the major indexes were fueled by optimism that the funding lapse won’t last long or do much damage to the economy. Historically, these shutdowns haven’t had a major impact on equity performance, and so far, this one seems to be following that pattern.
Still, the big question is: how long will this political standoff drag on? With the Senate taking Thursday off for Yom Kippur, the earliest next vote could be Friday. Prediction markets are leaning toward a shutdown that could stretch close to two weeks.
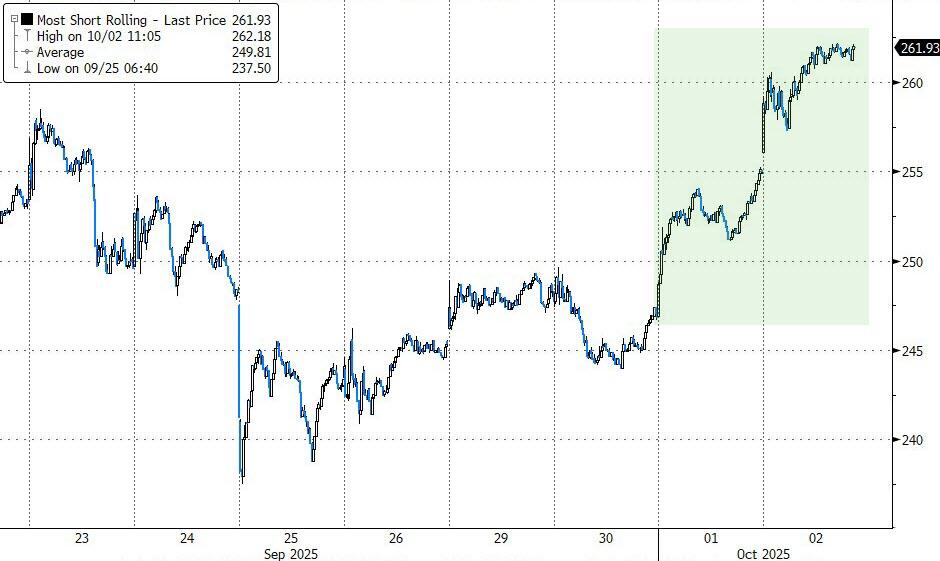
Despite the drama in Washington, the indexes managed to end the day in the green again. Even the most shorted stocks got a lift.
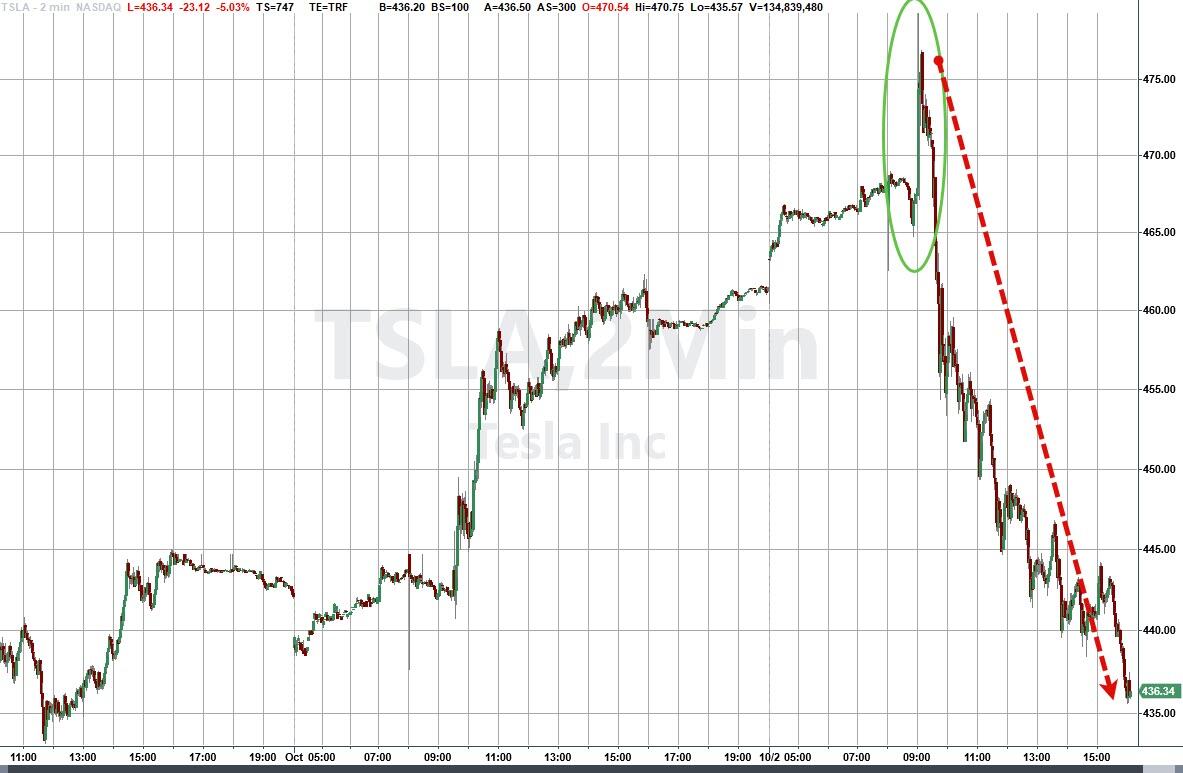
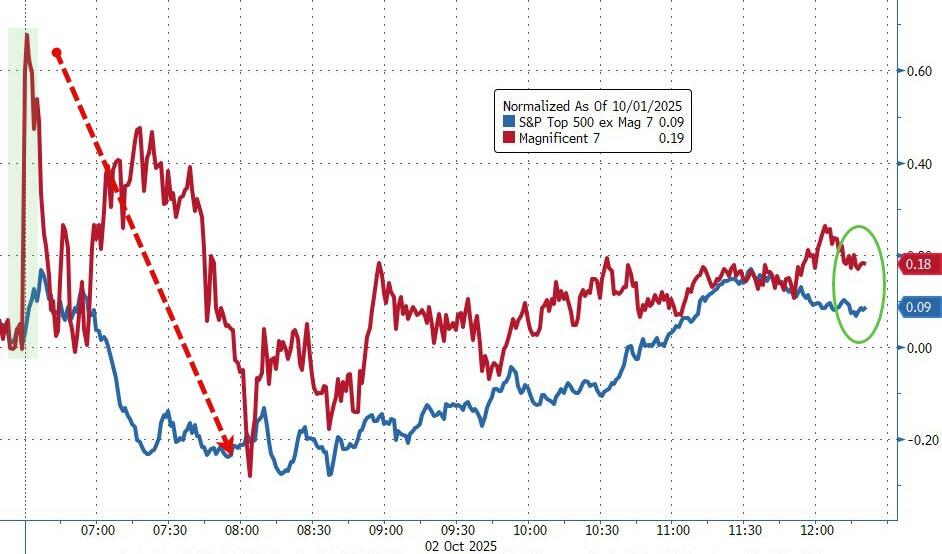
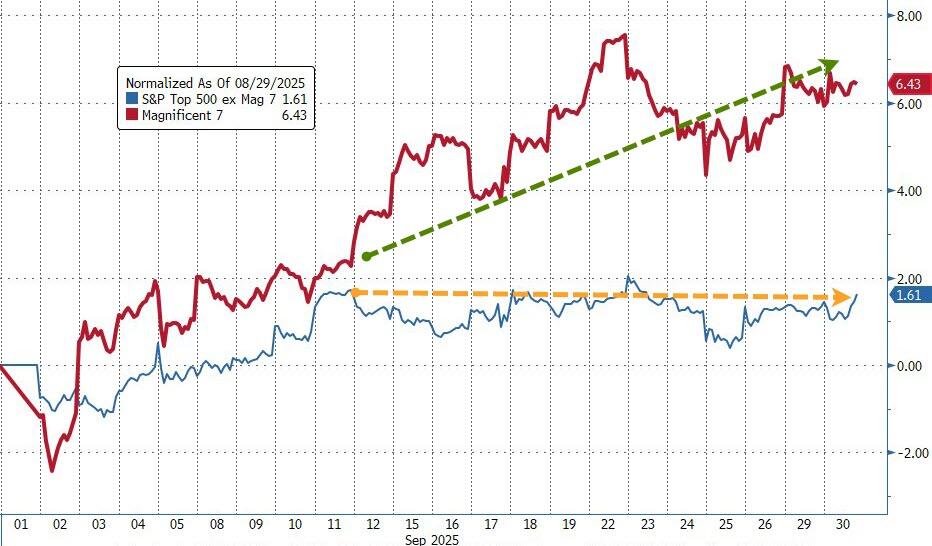
Tesla, however, took a 5% hit after an early rally fizzled out. The “Magnificent Seven” tech giants still outperformed the rest of the S&P 500, but only slightly.
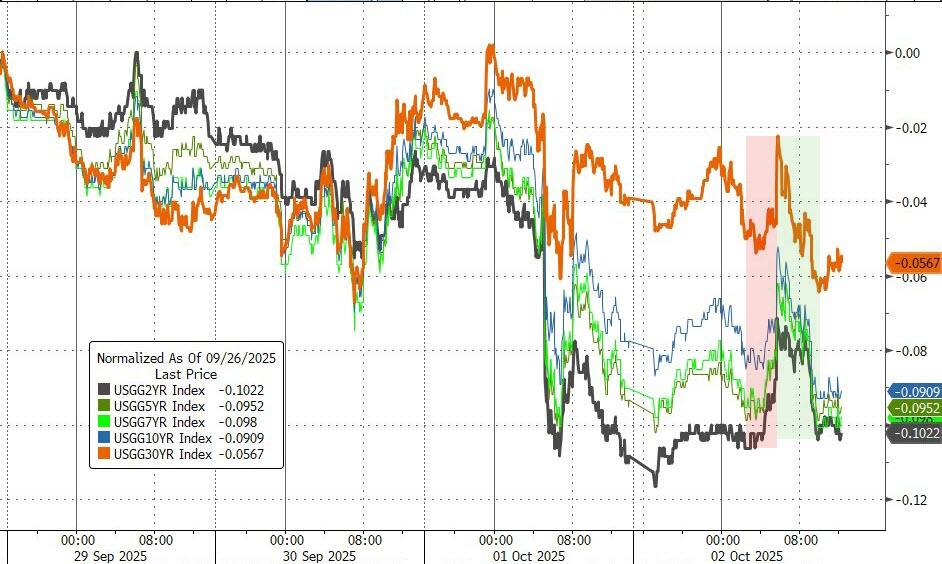
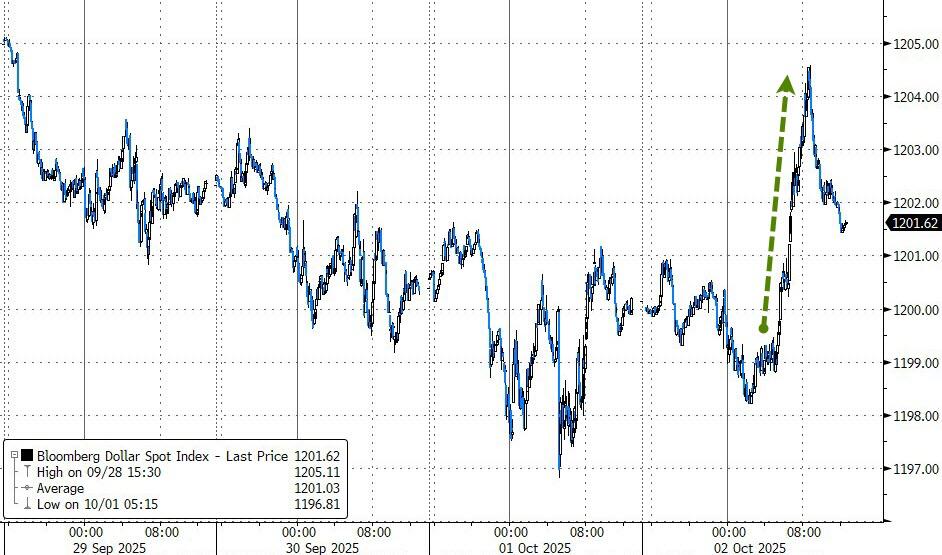
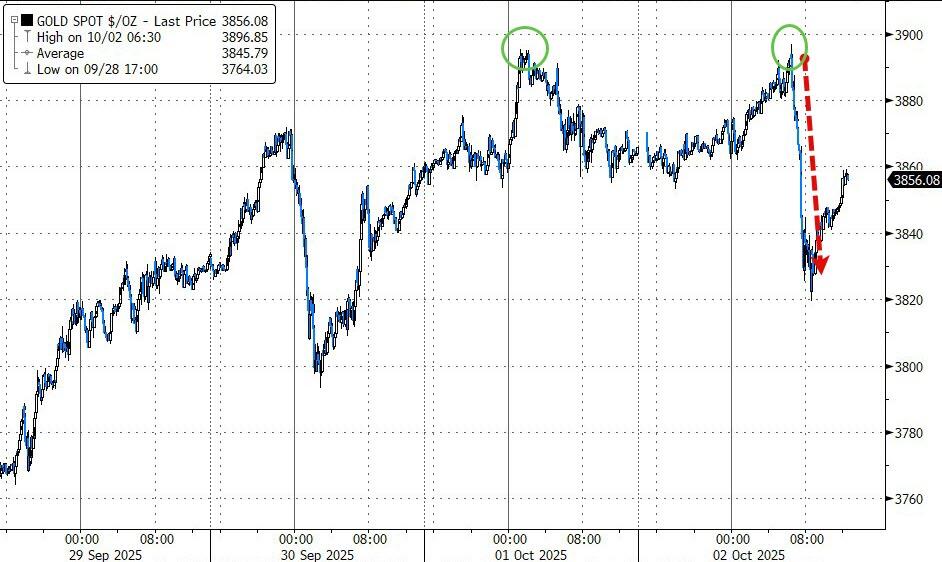
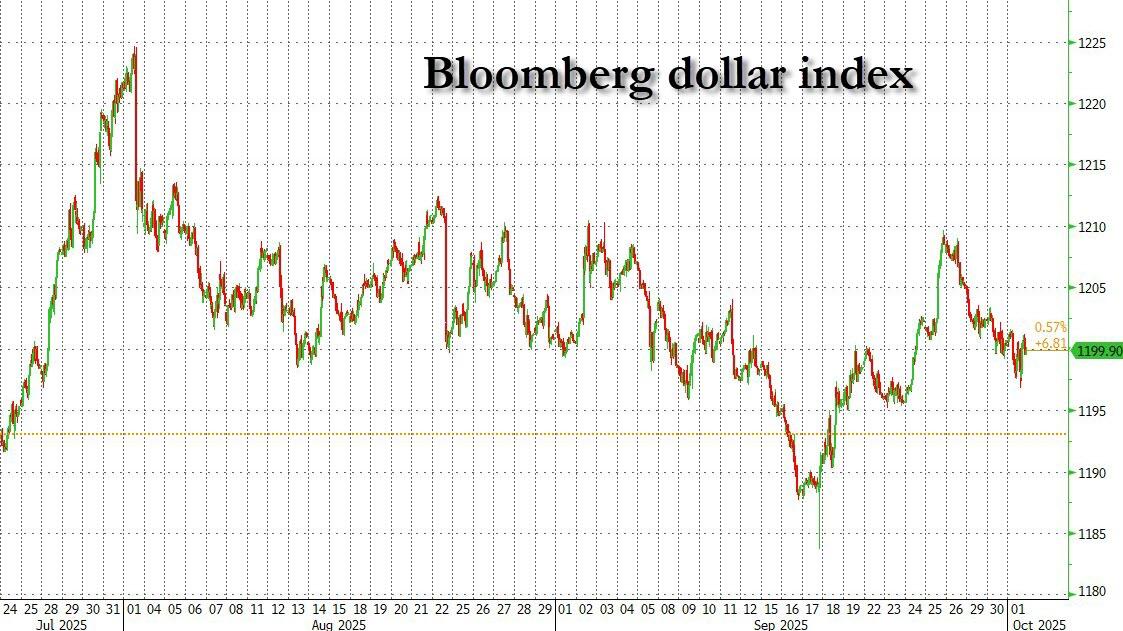
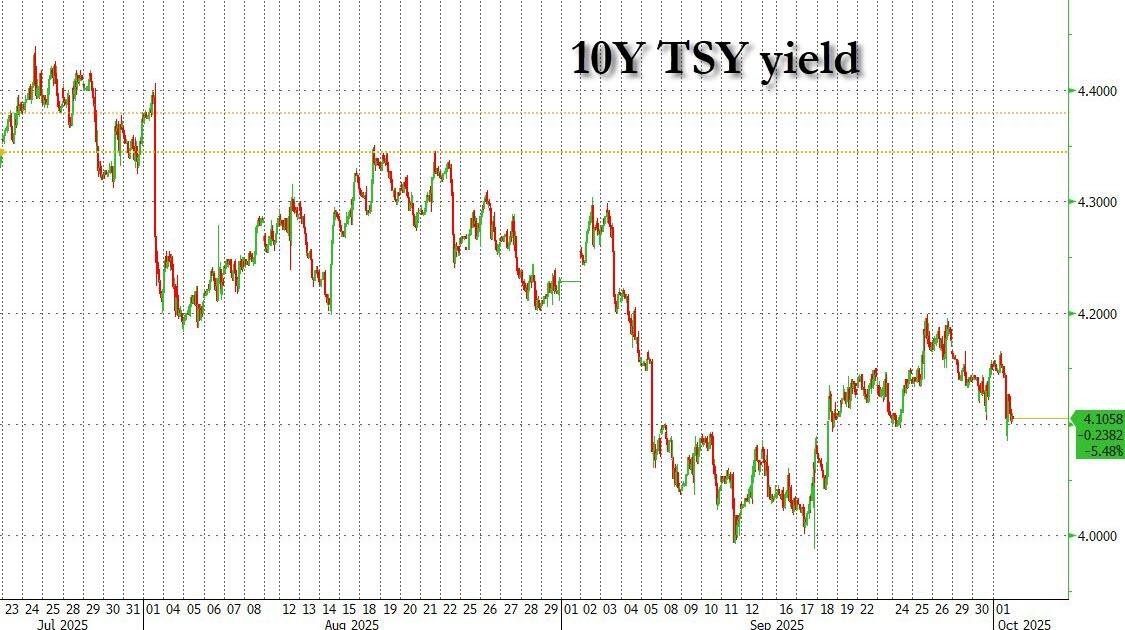
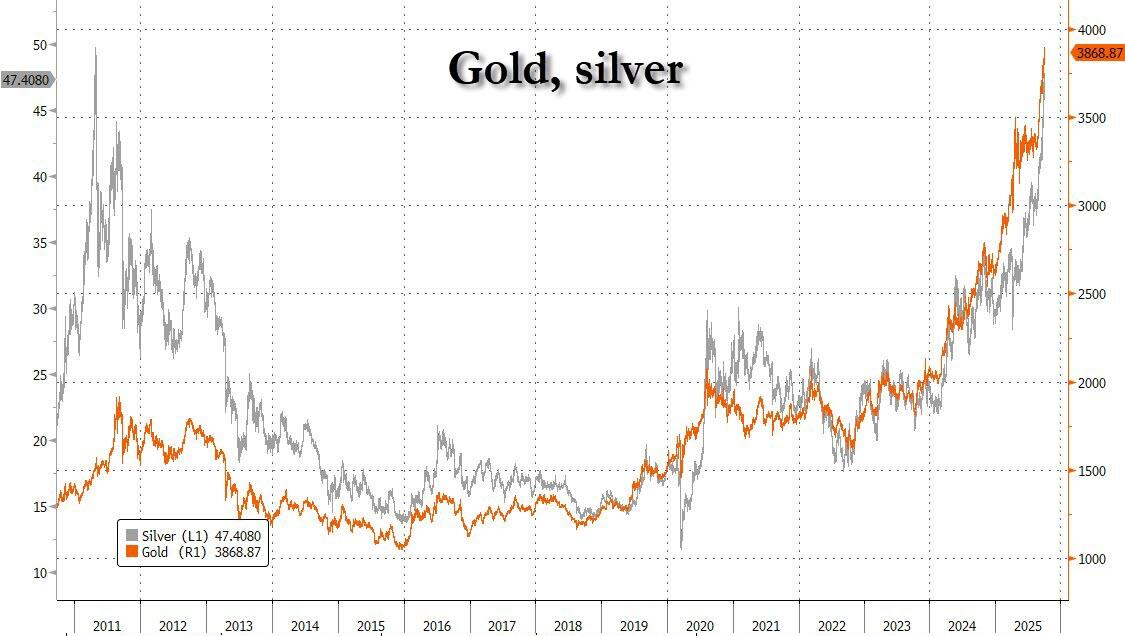
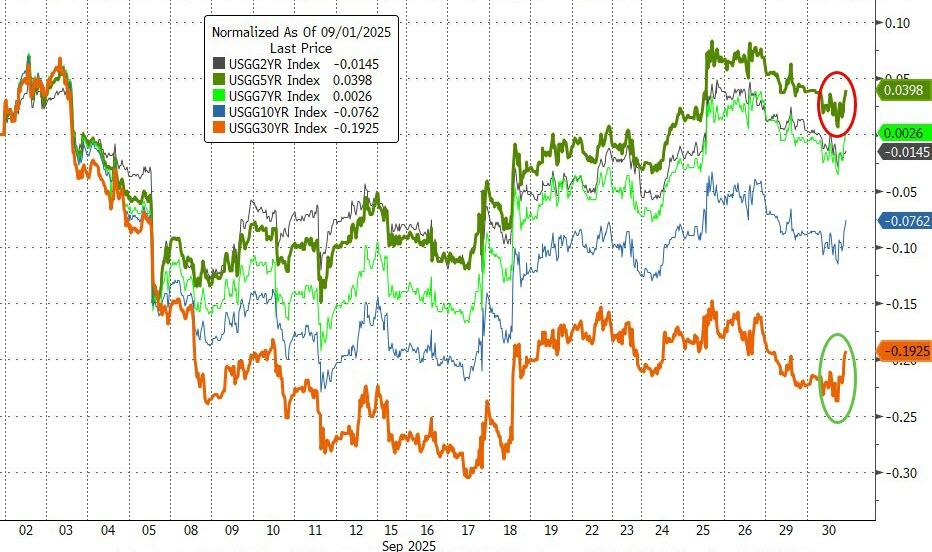
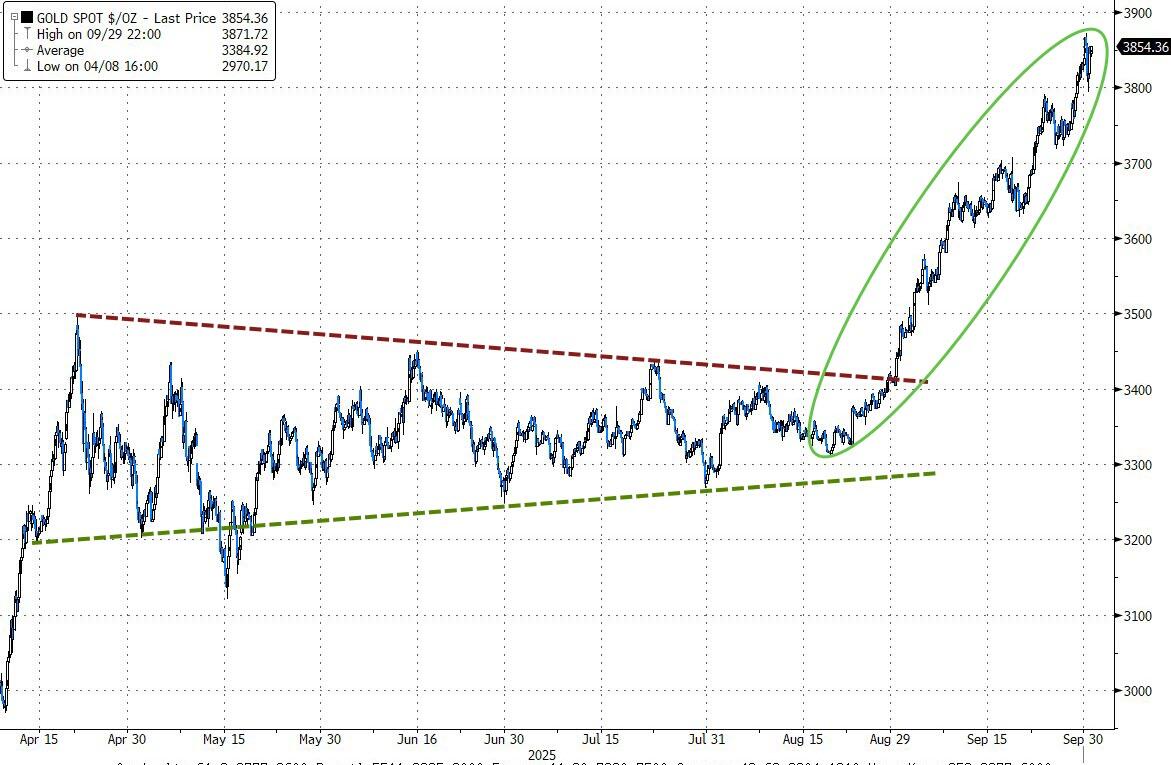
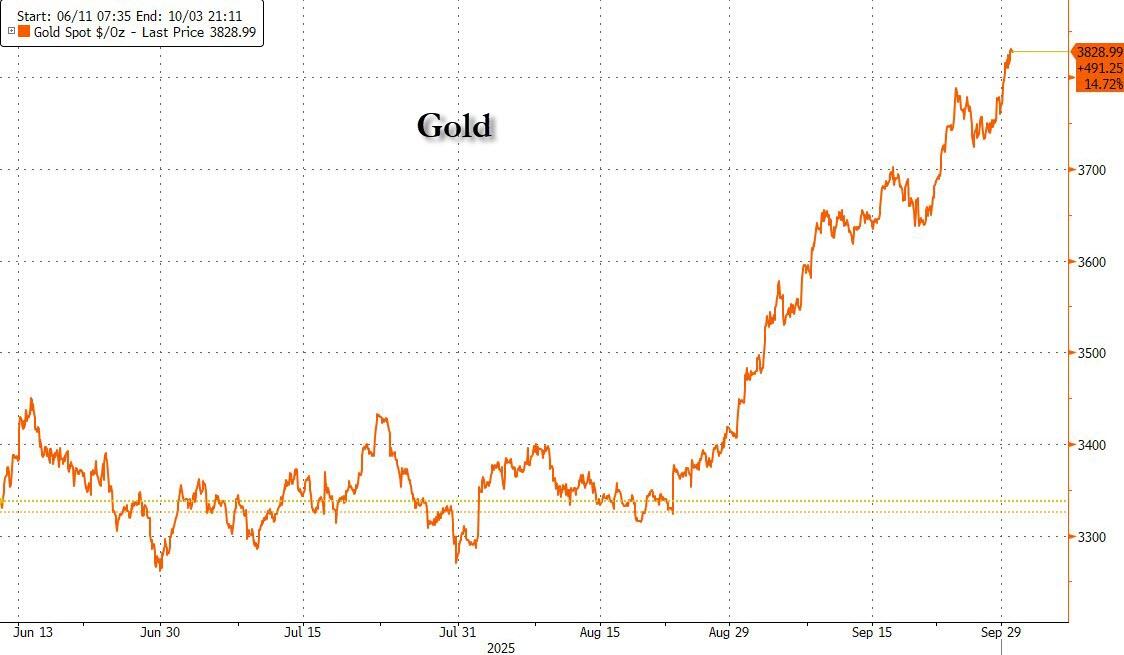
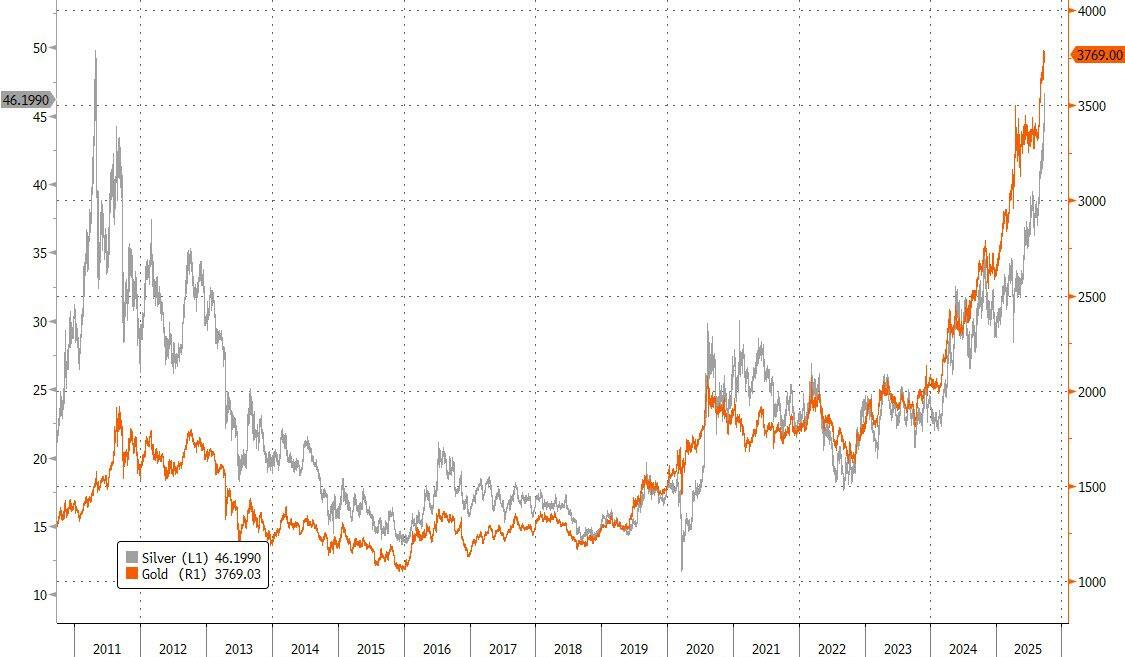
Bond yields were mixed, and the dollar jumped for no clear reason, which put pressure on gold. The metal tried to break past $3,900 but couldn’t quite make it.
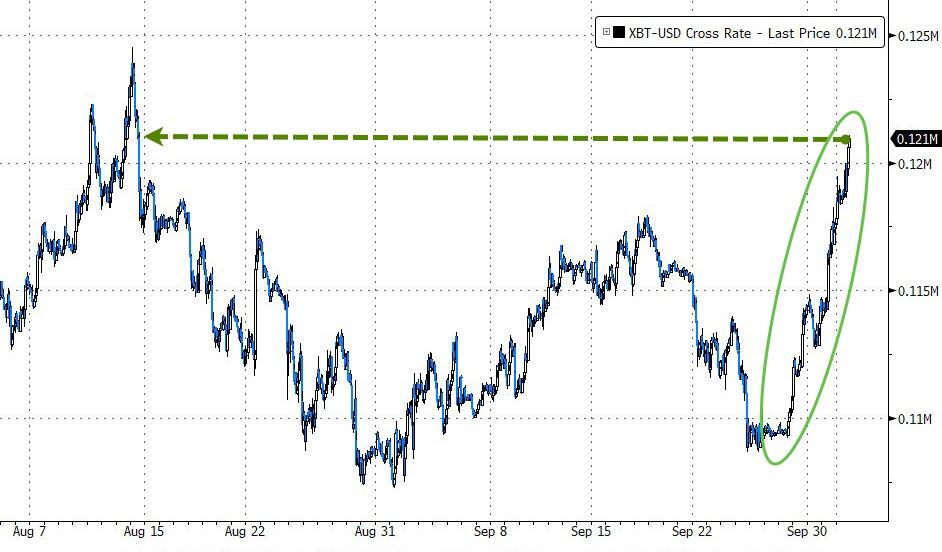
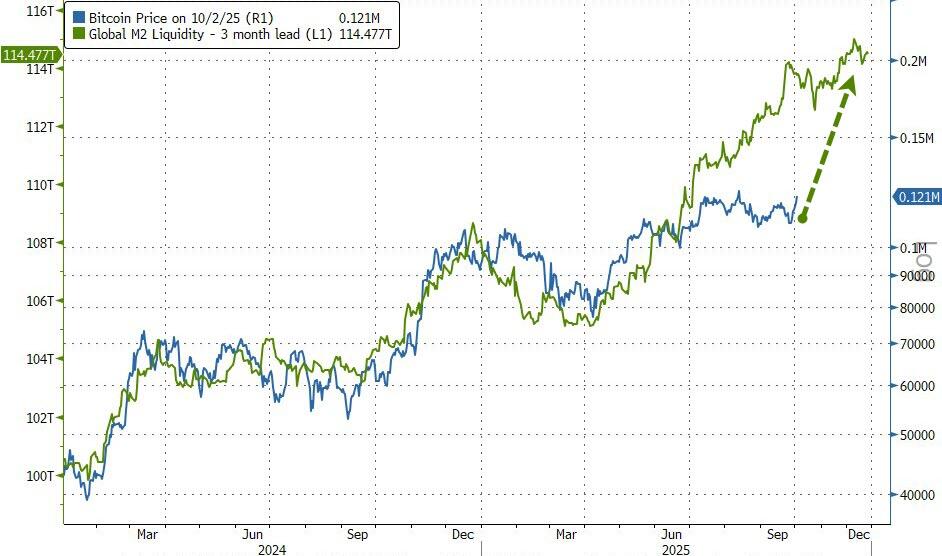
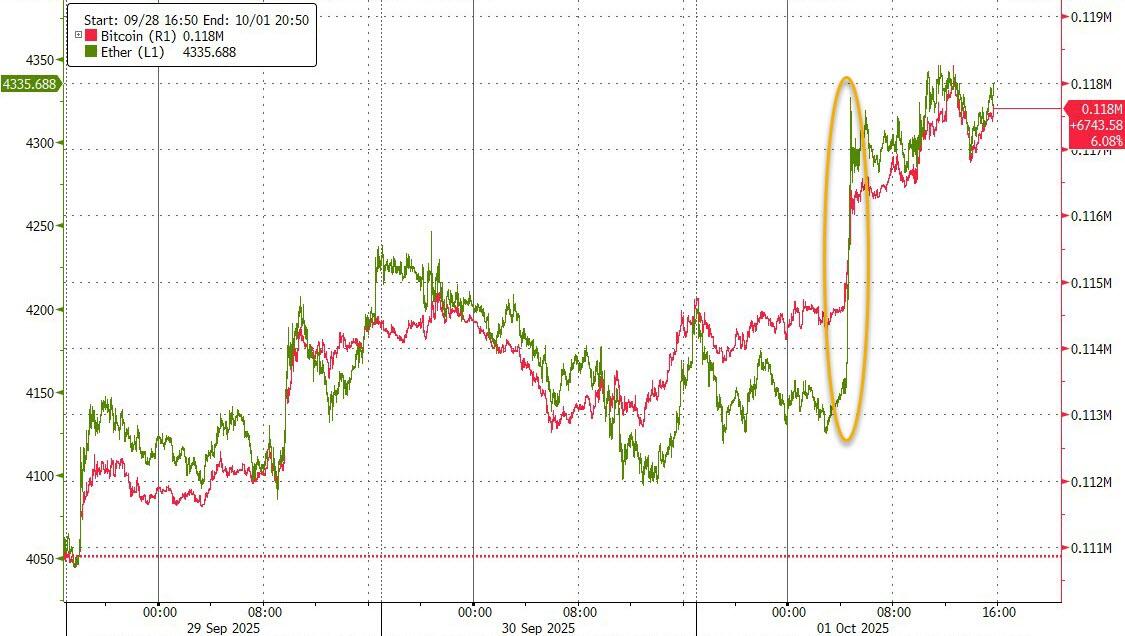
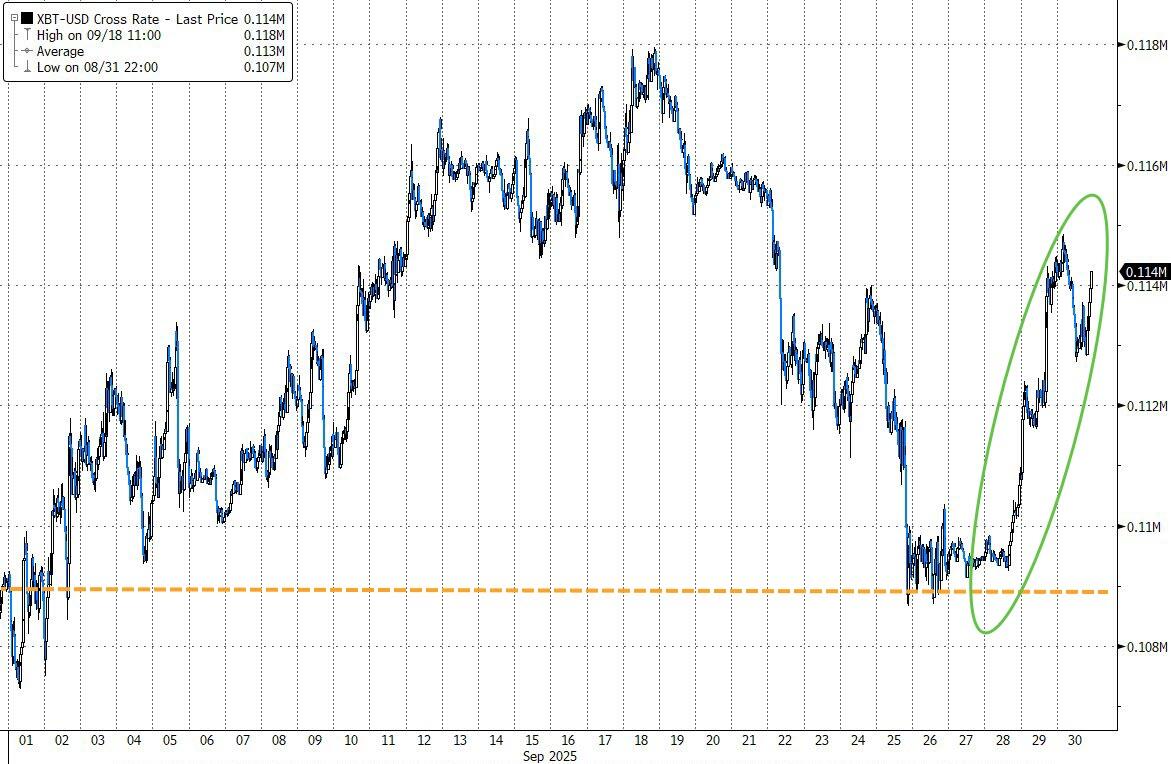
Meanwhile, Bitcoin surged to $121,000—a level not seen since mid-August.
So, here’s the question: Is digital gold finally syncing back up with global liquidity again?
Read More