S&P 500 Nears Year-End Predictions Amidst Housing Market Collapse And Inflation Fears

Ulli Market Commentary Contact

[Chart courtesy of MarketWatch.com]

  1. Moving the markets

Two of the three major indexes slipped early on, while the Nasdaq powered higher, as Nvidia edged up another 1% on top of Tuesday’s 7% gain. However, it had given most of it back by the time the closing bell rang.

The MAG 7 stocks bucked that wild ride and continued yesterday’s path higher on a smooth trajectory. Amazon was in the news as well, with the retail giant topping its $2 trillion market cap for the first time.

The S&P 500, despite notching a few losing sessions recently, is on track to close out the first half of the year with a gain of some 15%. That performance was due to the tech sector’s surge with Nvidia being up some 150% for the same period.

Of course, speculation runs rampant whether the recent pullback means the end of the bullish runup. After all, the S&P 500 is trading within 1% of what many strategists have considered to be its year-ending price level.

The broad market’s sluggishness is likely tied to trader anxiety about Friday’s inflation data release, namely the Fed’s favorite gauge, the PCE (Personal Consumption Expenditure price index). If this reading comes in lower than expected, Wall Street will rejoice and continue to push their agenda that rate cuts are on the horizon.

Today’s new home sales were a disaster, with markets literally imploding in May, as sales crashed 11.3% MoM, which was its biggest drop since September 2022. Median new home prices fell 0.9% YoY to their lowest since April 2023.

Mortgage rates have consistently remained above 7%, placing pressure on the Federal Reserve to intervene and provide relief to the housing market.

However, the Fed faces a challenging dilemma: lowering rates to stimulate the housing market could inadvertently fuel inflation to potentially unprecedented heights.

Not a good alternative.

Read More

Mixed Economic Signals As Tech Rises And Consumer Confidence Wavers

Ulli Market Commentary Contact

[Chart courtesy of MarketWatch.com]

  1. Moving the markets

A rebound in the tech sector helped the S&P 500 and Nasdaq to find some footing, with both indexes starting and ending the session on a positive note. Nvidia gave a much-needed assist by bouncing back from its latest slide, as did the MAG 7 stocks.

The recent sell off pushed the AI darling more than 13% off its highs and into correction territory, as other semiconductor stocks also had to deal with sudden pullbacks. The Dow saved the day by maintaining its bullish theme.

So far this type of correction is perfectly normal given the sharp advances during the first half of 2024. Besides, summertime, or specifically Q3, can be slow and typically scores as the worst quarter in any year.

Consumer Confidence is not helping the economic outlook with the index moving down to 100.4, which was a slight drop from May’s reading of 101.3 but exceeded expectations of 100. Still, this index seems to have been stuck in a tight range for the past 2 years.

From a Macro point of view, “hard” and “soft” data ended lower, with bonds basically closing unchanged. The majors offered a mixed picture, as the graph above shows. Tech was the lead dog for the day, while energy trod water but all other sectors were in the red.

The dollar bounced, gold slipped back to Friday’s lows, but Bitcoin found support and rallied sharply. Crude oil succumbed to profit taking and stumbled back into last week’s trading range.

As ZH pointed out, the US Macro Surprise index has now dropped to its lowest level since March 2019.

How does that align with the Fed’s constant jawboning that the economy is doing well?

Read More

Economic Crossroads: Inflation Data Looms As Gold And Oil Rally, Bitcoin Bruised

Ulli Market Commentary Contact

[Chart courtesy of MarketWatch.com]

  1. Moving the markets

The Nasdaq was lagging as today’s session got underway with traders rotating out of the overbought tech sector and into financials, utilities, and energy, with oil climbing above the $81 level. Only the Dow managed a green close.

Nvidia dropped some 5% on top of last week’s 4% decline, after the stock snapped an eight-week winning streak. Analysts are interpreting its chart pattern as bearish but still are considering this pullback as “healthy” and possibly as a dip buying opportunity.

The MAG 7 stocks got dragged down as well, the most shorted stocks were squeezed, while Small Caps and the Dow outperformed.

Shifting expectations for rate cuts and a slowing economy have created a picture of concerns, but reckless enthusiasm about the development in the Artificial Intelligence arena has been the driver for a select group of equities and their indexes, while the broad market has struggled.

This week’s upcoming key inflation data, namely the Fed preferred PCE (Personal Consumption Expenditure index) will be closely analyzed to see if its reading can pursue the
Fed to finally please the markets by easing up on their hawkish policy.  

Bond yields slipped a tad, the dollar corrected sharply, but gold showed some strength after the recent sell off, as did crude oil, which headed towards its April highs. Bitcoin got spanked, as a variety of rumors took down bullish sentiment with the price dropping to its lowest since early May.   

Some 80% of the S&P 500 has now entered the buyback blackout window, as ZH pointed out. Does that mean that some of the reckless bullish enthusiasm will finally meet reality?

Only time will tell.

Read More

ETFs On The Cutline – Updated Through 06/21/2024

Ulli ETFs on the Cutline Contact

Do you want to know which ETFs are hot and which ones are not? Then you need my High-Volume ETF Cutline report. It tells you how close or far each of the 311 ETFs I follow is from its long-term trend line (39-week SMA). These are the ETFs that trade more than $5 million a day, so they are not some obscure funds that nobody cares about.

The report is split into two parts: The winners that are above their trend line (%M/A), and the losers that are below it. The yellow line is the line of shame that separates them. You can see how many ETFs are in each group and how they have changed since the last report (262 vs. 268 current).

Take a peek:

The HV ETF Master Cutline Report

If you are confused by some of the terms we use, don’t panic. I have a helpful Glossary of Terms for you.

If you want to learn more about the Cutline method and how it can make you rich (or at least less poor), read my original post here.

ETF Tracker Newsletter For June 21, 2024

Ulli ETF Tracker Contact

ETF Tracker StatSheet          

You can view the latest version here.

TRIPLE WITCHING LEAVES MARKETS UNSHAKEN, BUT ECONOMIC INDICATORS SUGGEST CAUTION AHEAD

[Chart courtesy of MarketWatch.com]

  1. Moving the markets

The major indexes wavered around their unchanged lines, as this monster of an options expiration session got underway. Nvidia slipped over 3% but given its 150% gain YTD, that move is insignificant.

For sure, we have seen some signs of market exuberance or overextension, but it’s too early to judge whether there is more room for the AI fueled rally on the upside. However, we know that this relentless rise will not go on forever.

That does not mean a crash is imminent, we could very well see the narrowly based advance broaden and include the “neglected” sectors that have been lagging. In other words, some kind of rebalancing may contribute to positive sentiment and be the next driver to keep this market alive.

Again, trading volatility was likely be an outlier due to triple witching, the expiration of stock options, stock index options and stock index futures options. Surprisingly, the major indexes traded in a tight trading range with not much lost and not much gained.   

In terms of economic data points, this week was unpleasant, as the Economic Surprise Index tanked, mainly due to “hard” data scoring its worst decline since September 2022, while “soft” data improved off nine-year lows, as ZH pointed out.

Energy outperformed this week, Nvidia suffered its first down-week in two months, while bond yields inched up slightly. The dollar gained a tad, Bitcoin lost some mojo, gold was up but got sold sharply this morning therefore ending the week in the red.

Crude oil rallied to its highest since April despite taking dip in today’s the session. That will have an effect on pump prices in the near future.   

With the Economic Surprise index tanking, you would think that stock prices would be negatively influenced, but you would be wrong. The divergence is as wide as ever, which makes me ponder what it will take to revert back to reality.  

Read More

Weekly StatSheet For The ETF Tracker Newsletter – Updated Through 06/20/2024

Ulli ETF StatSheet Contact

ETF Data updated through Thursday, June 20, 2024

How to use this StatSheet:

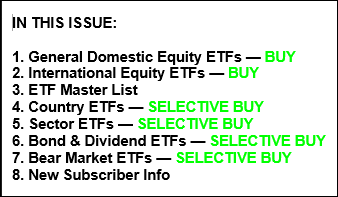
  1. Out of the 1,800+ ETFs out there, I only pick the ones that trade over $5 million per day (HV ETFs), so you don’t get stuck with a lemon that nobody wants to buy or sell.
  1. Trend Tracking Indexes (TTIs)

These are the main indicators that tell you when to buy or sell Domestic and International ETFs (section 1 and 2). They do that by comparing their position to their long-term M/A (Moving Average). If they cross above, and stay there, it’s a green light to buy. If they fall below, and keep going, it’s a red light to sell. And to make sure you don’t lose your shirt if things go south, I also use a 12% trailing stop loss on all positions in these categories.

  1. All other investment areas don’t have a TTI and should be traded based on the position of each ETF relative to its own trend line (%M/A). That’s why I call them “Selective Buy.” In other words, if an ETF goes above its own trend line, you can buy it. But don’t forget to use a trailing sell stop of 12%, or less if you’re feeling nervous.

If some of these words sound like Greek to you, please check out the Glossary of Terms and new subscriber information in section 9.

  1. DOMESTIC EQUITY ETFs: BUY— since 11/21/2023

Click on chart to enlarge

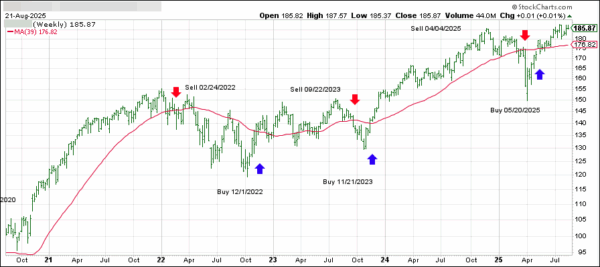
This is our main compass, the Domestic Trend Tracking Index (TTI-green line in the above chart). It has broken above its long-term trend line (red) by +6.42% and is in “Buy” mode as posted.

Read More