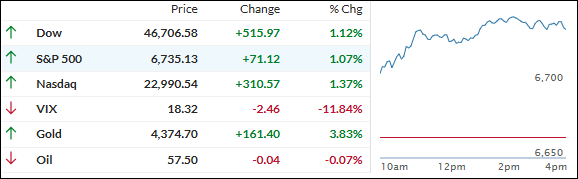
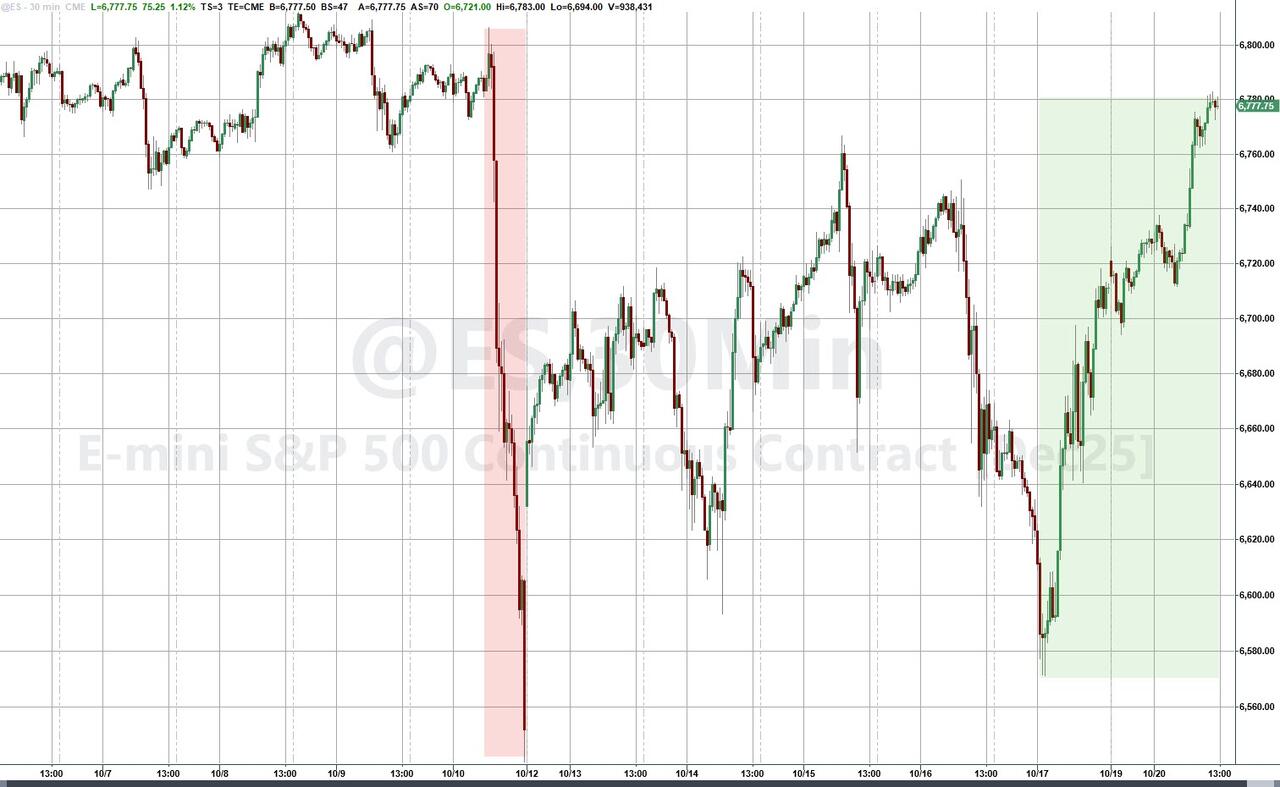
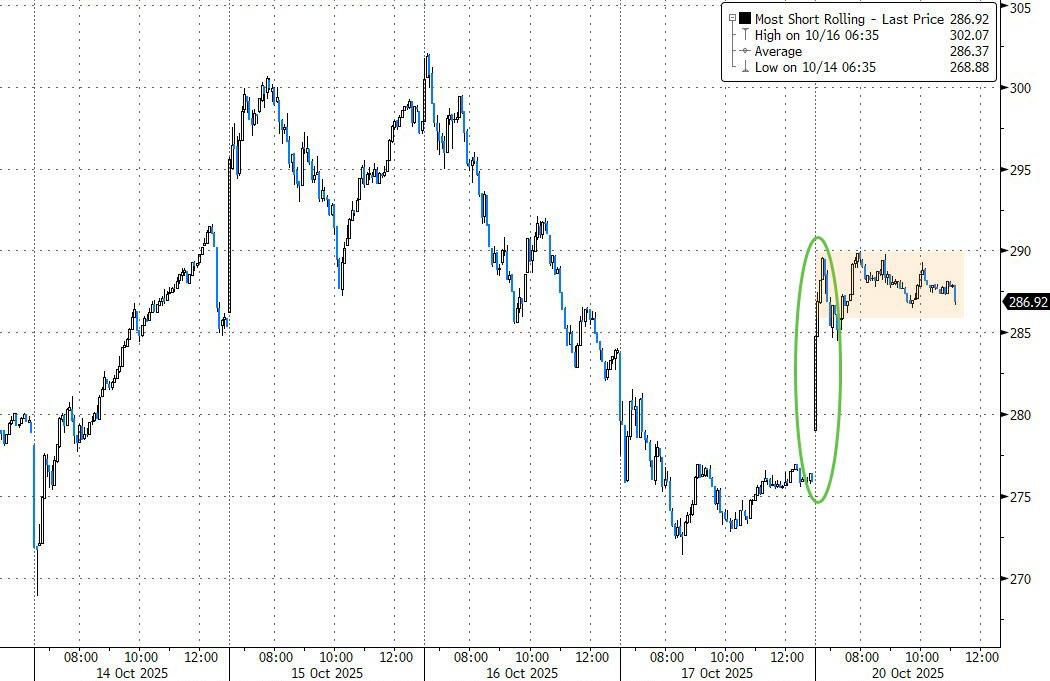
Stocks burst out of the gate this morning, with major indexes surging as traders turned their attention to a heavy week of earnings reports, fresh inflation data, and growing hopes that the prolonged U.S. government shutdown might finally wrap up.
Optimism got an extra boost after National Economic Council Director Kevin Hassett said he expects the shutdown “to end sometime this week,” suggesting moderate Democrats could help strike a deal to reopen the government, now in its 20th day.
The upbeat tone follows a turbulent week marked by trade tensions, regional bank jitters, and weakness in AI stocks. Still, Wall Street is finding its footing again thanks to resilient bank earnings, cooling yields, and improving sentiment.
All eyes now turn to a packed earnings calendar—with Tesla, Netflix, Intel, and Coca-Cola among the big names reporting—as investors look for confirmation that corporate profits remain on solid ground.
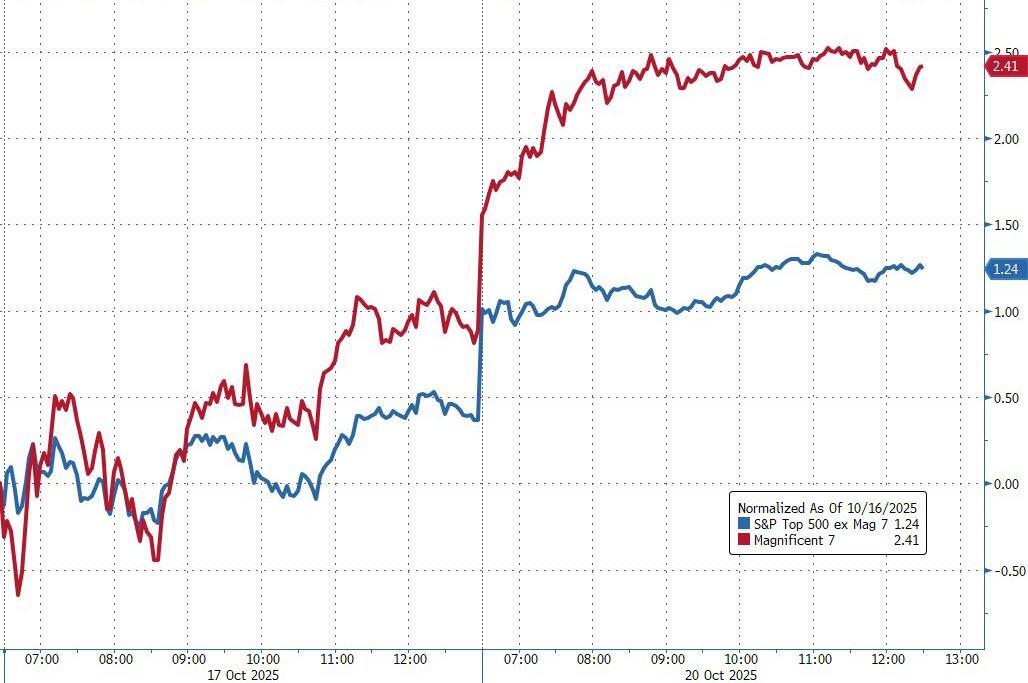
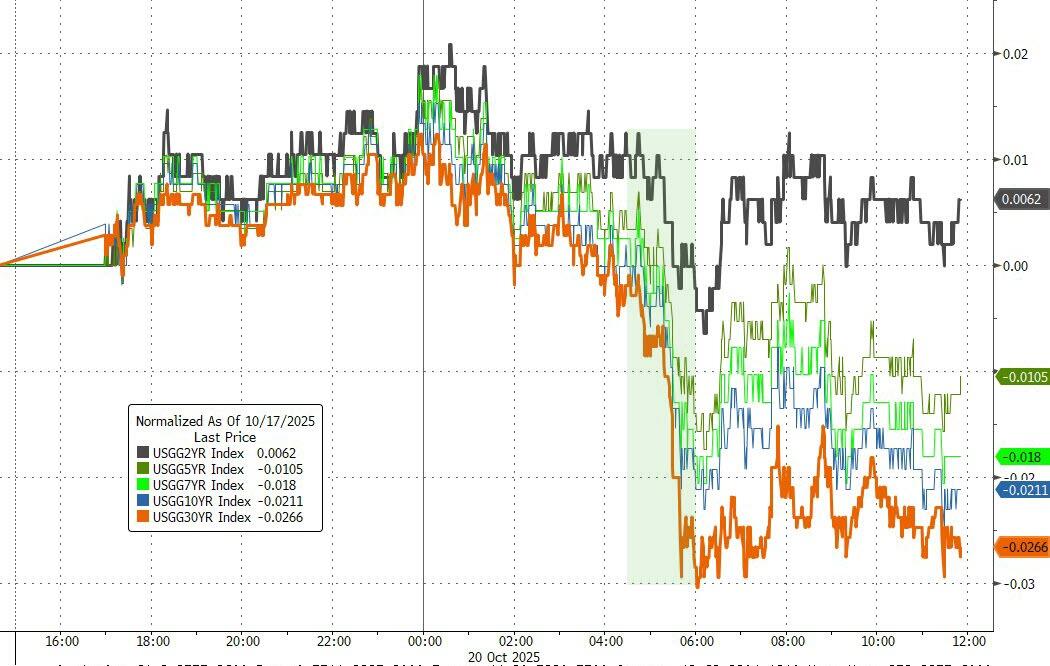
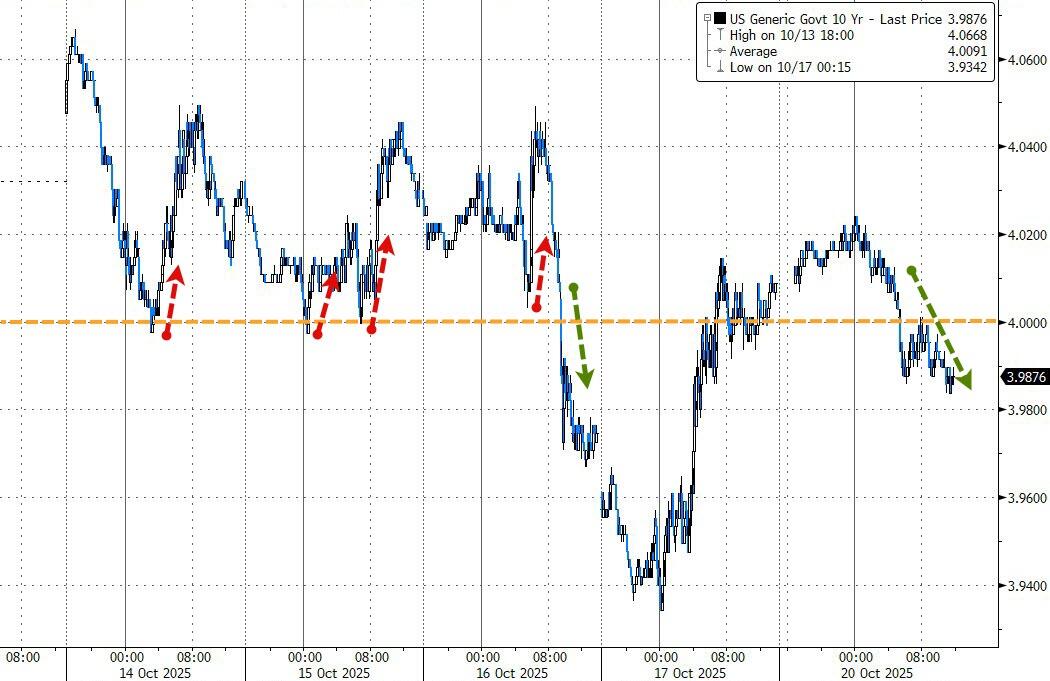
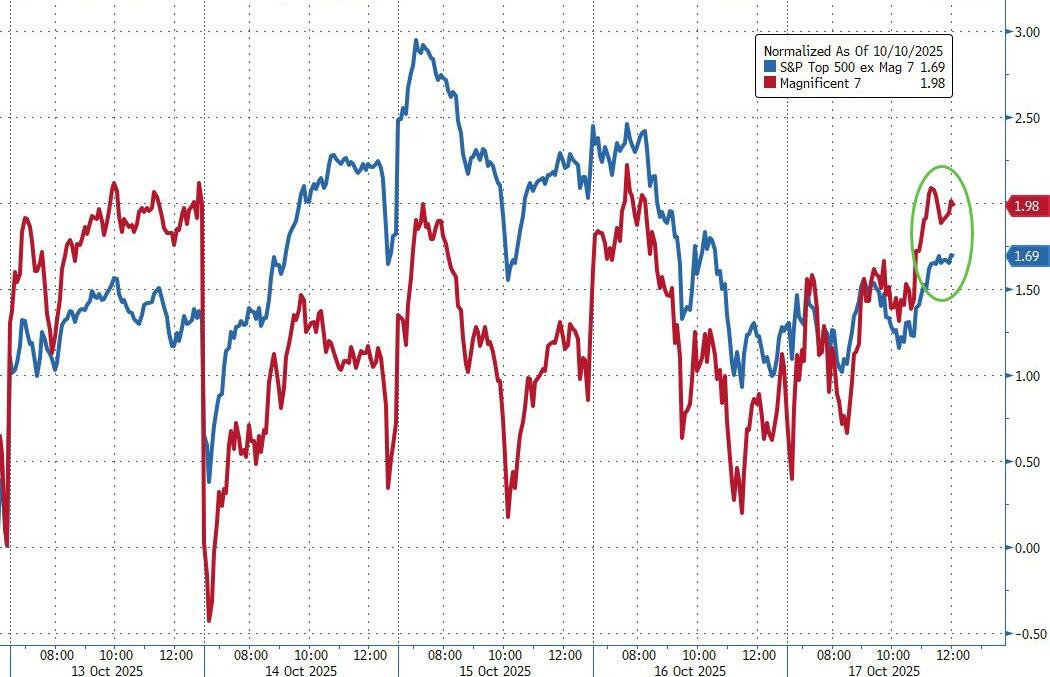
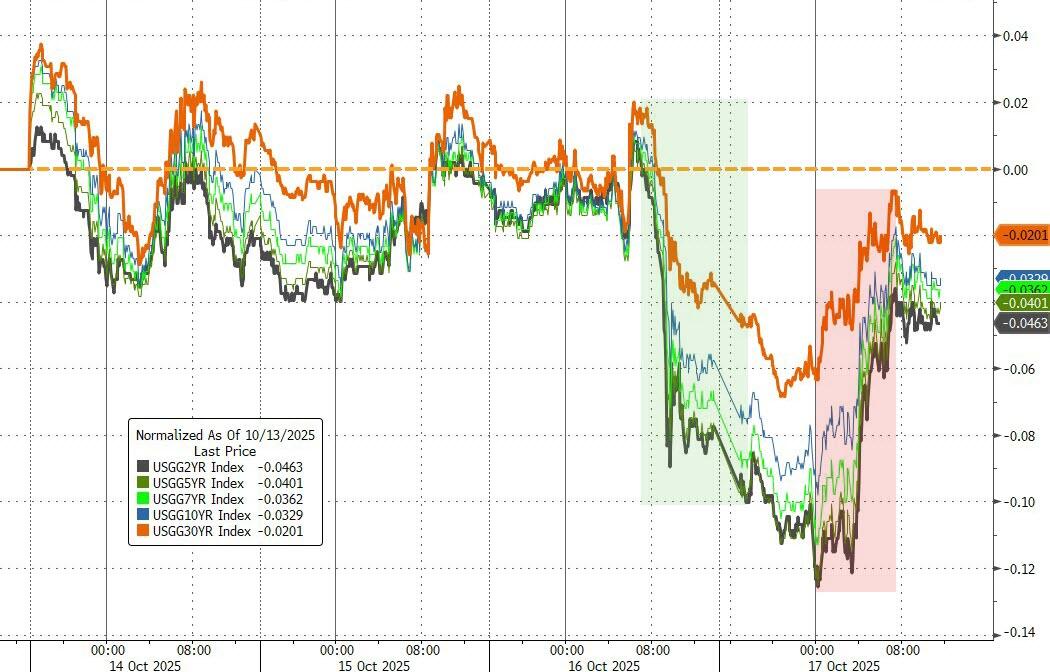
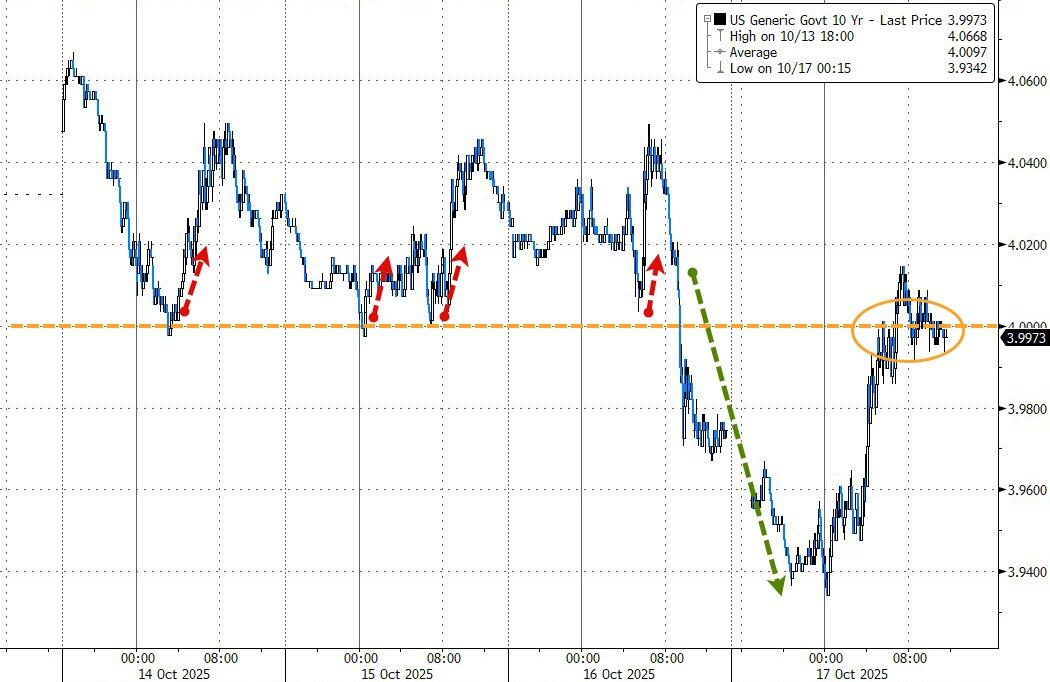
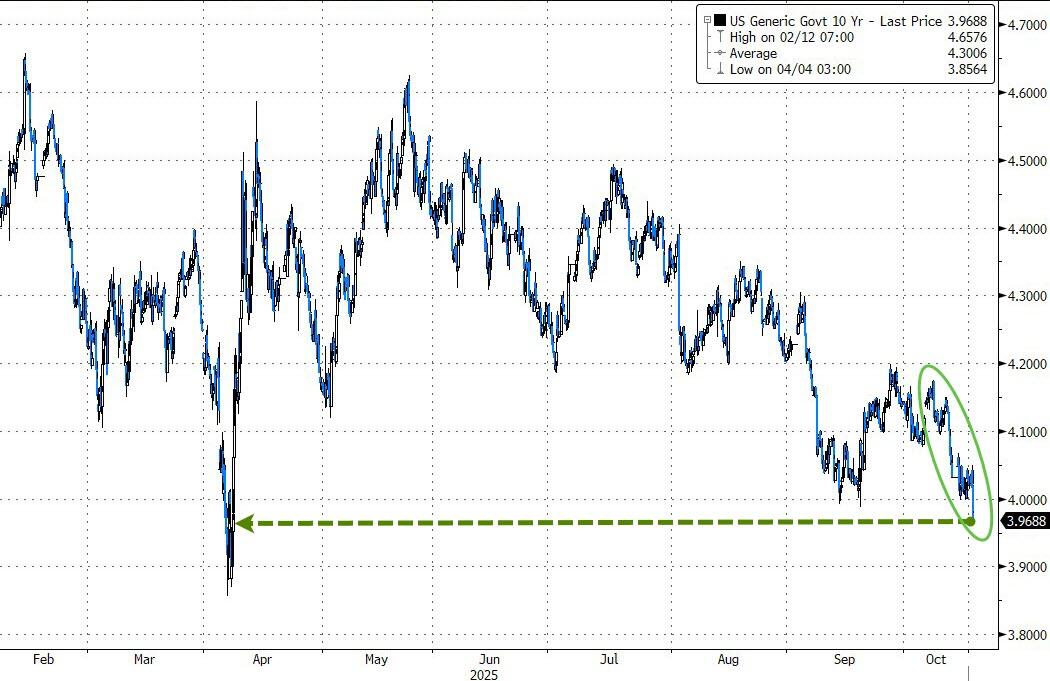
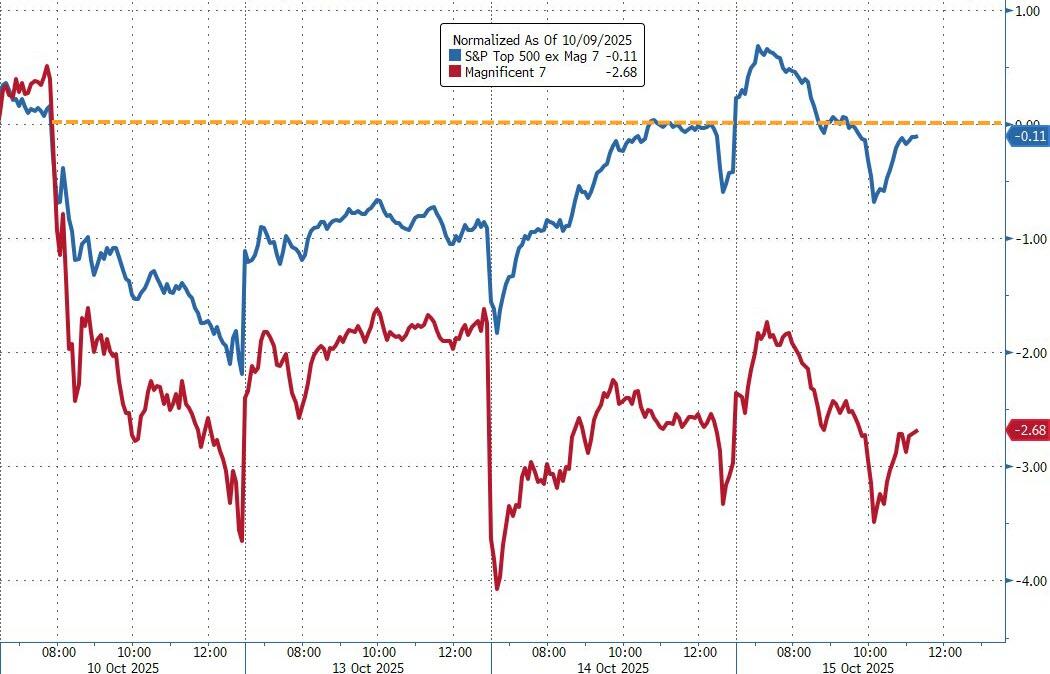
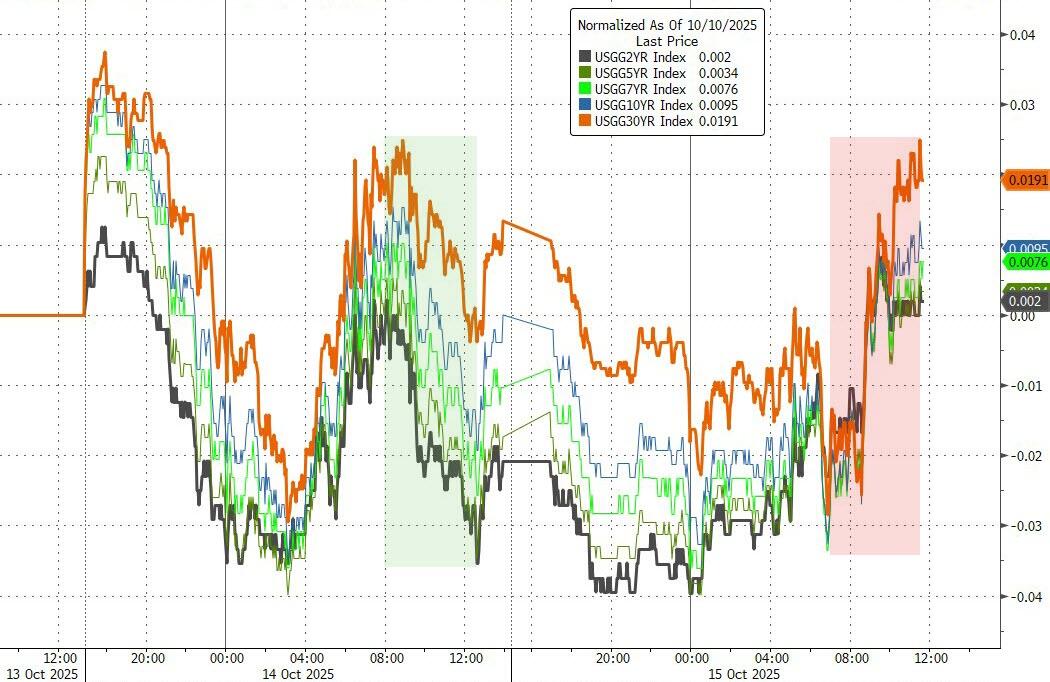
The “Mag 7” stocks outperformed the broader S&P once again, helped by easing yields, with the 10-year Treasury sliding back below 4%.
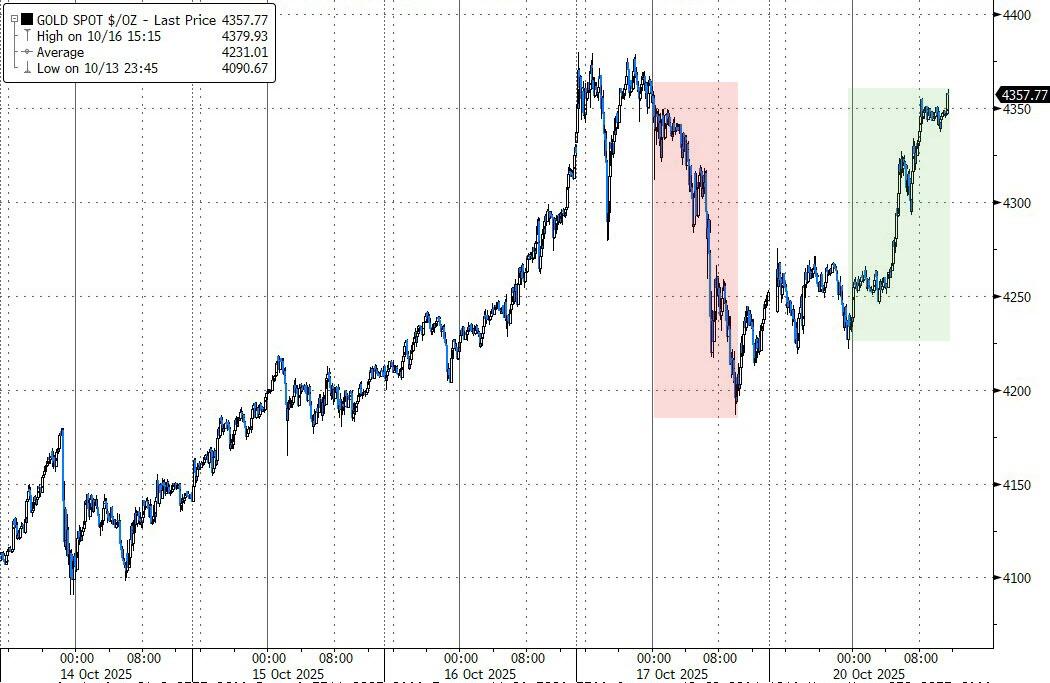
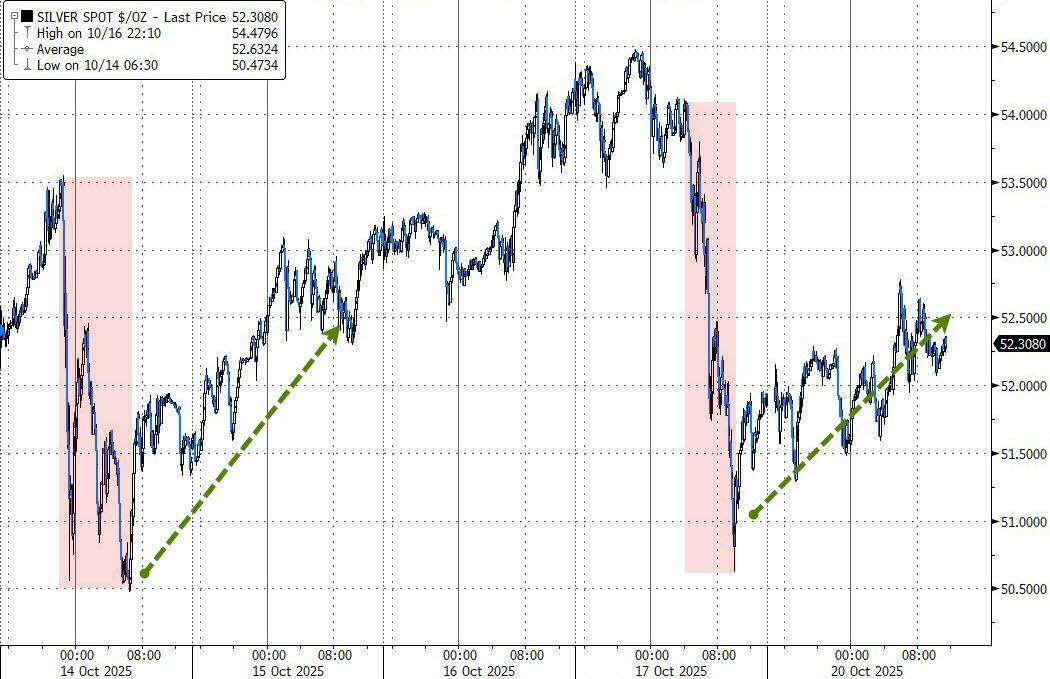
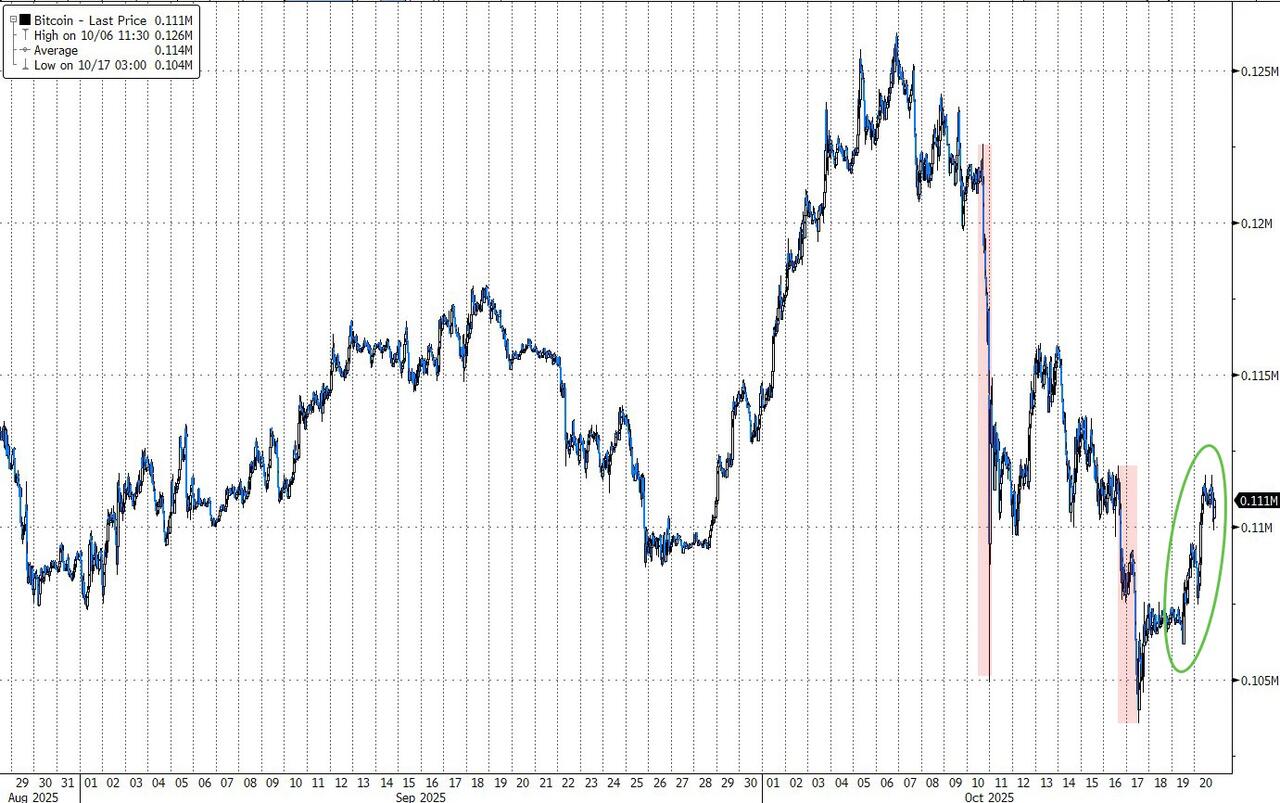
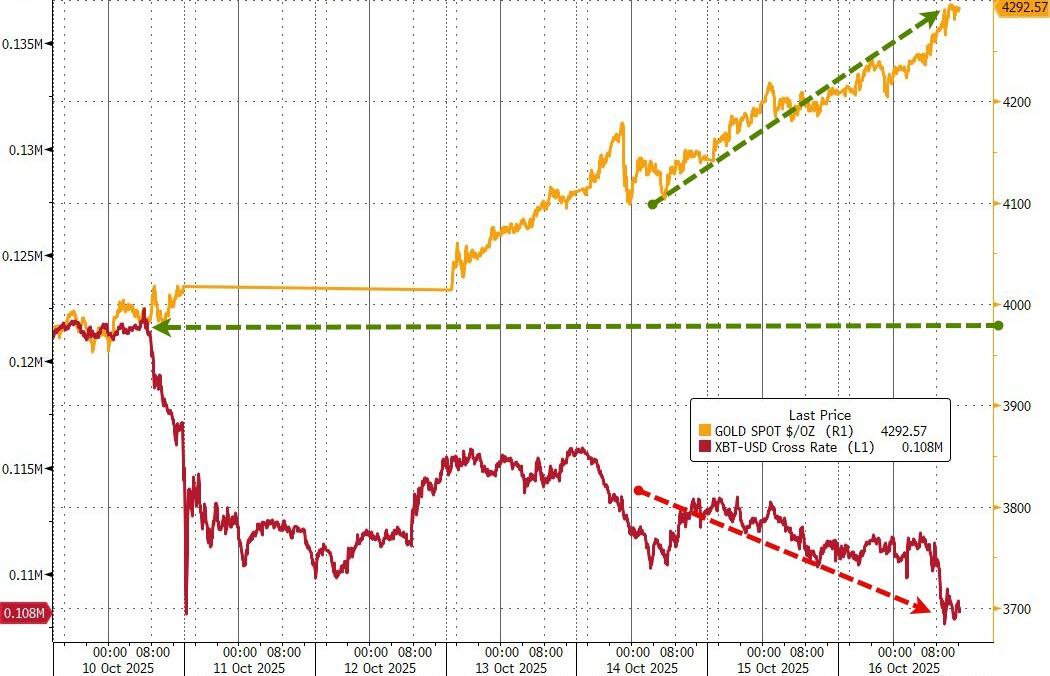
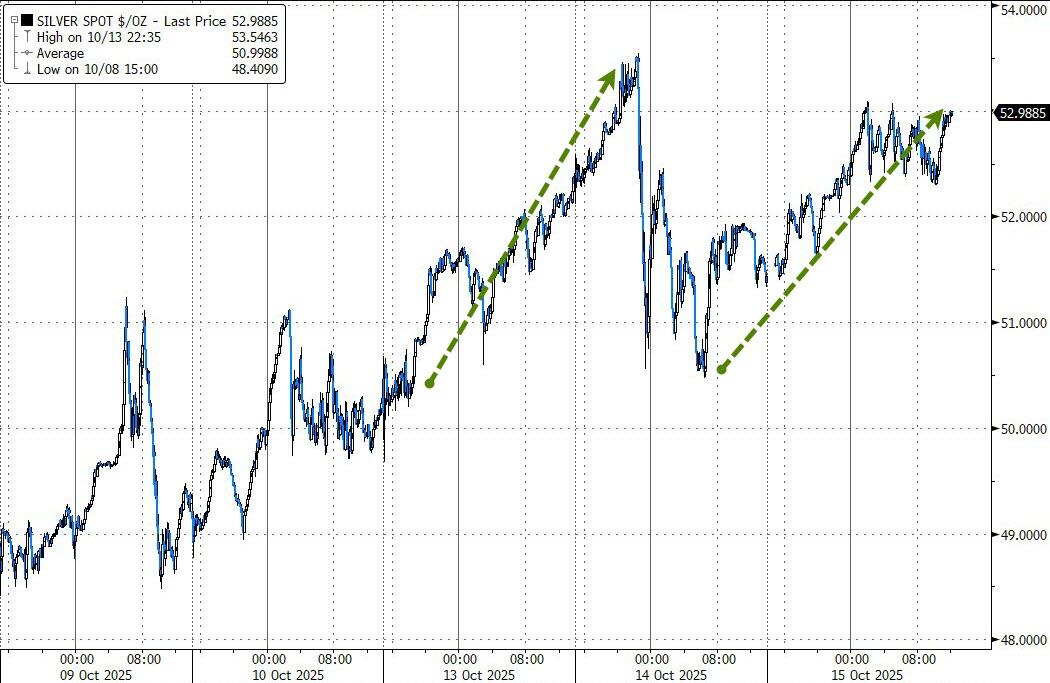
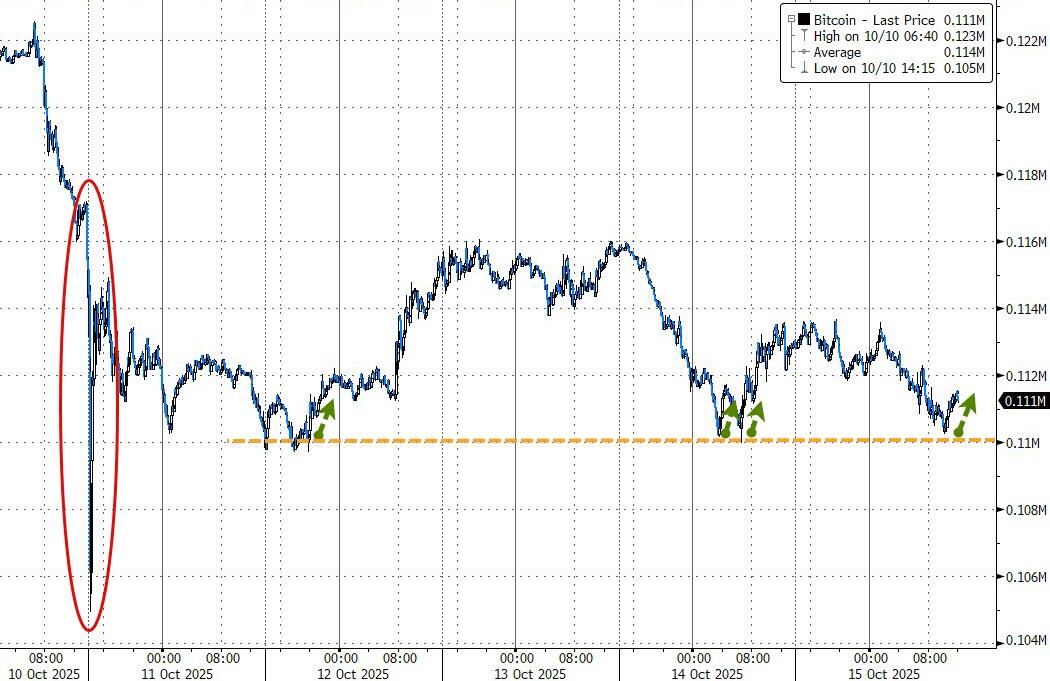
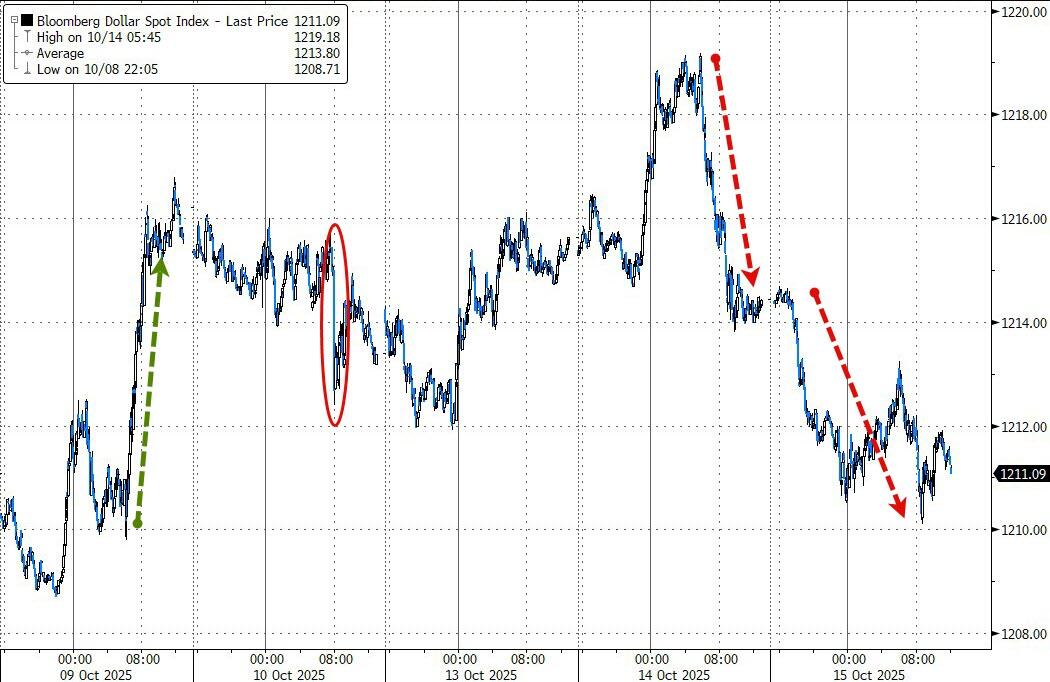
Gold stole the spotlight, soaring nearly 4%, while silver climbed modestly. Even bitcoin got in on the action, bouncing roughly 4% to approach $111,000 despite a stronger dollar.
With earnings season heating up and talk of a shutdown resolution lifting spirits, can the market keep this momentum going through the end of October—or will volatility make an untimely return?
Do you want to know which ETFs are hot and which ones are not? Then you need my High-Volume ETF Cutline report. It tells you how close or far each of the 311 ETFs I follow is from its long-term trend line (39-week SMA). These are the ETFs that trade more than $5 million a day, so they are not some obscure funds that nobody cares about.
The report is split into two parts: The winners that are above their trend line (%M/A), and the losers that are below it. The yellow line is the line of shame that separates them. You can see how many ETFs are in each group and how they have changed since the last report (266 vs. 280 current).
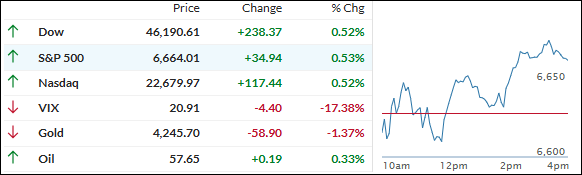
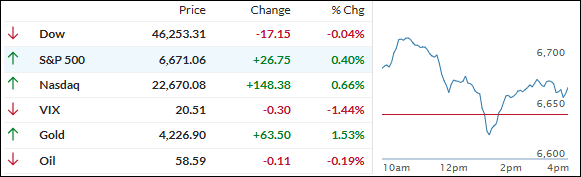
Stocks started the day mixed as traders tried to shake off lingering worries from Thursday’s steep selloff in regional banks. By the afternoon, confidence began to return, and the major indexes firmed up, eventually closing higher to cap off the week on a stronger note.
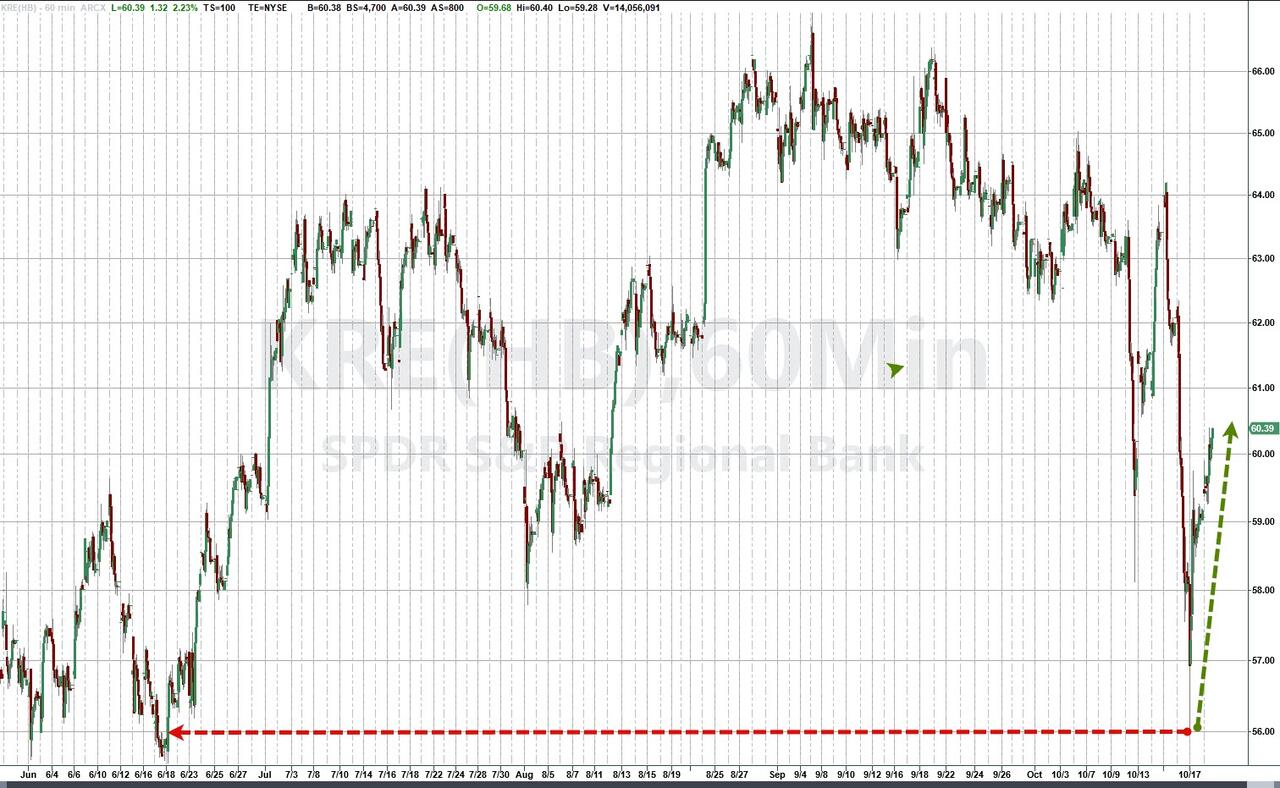
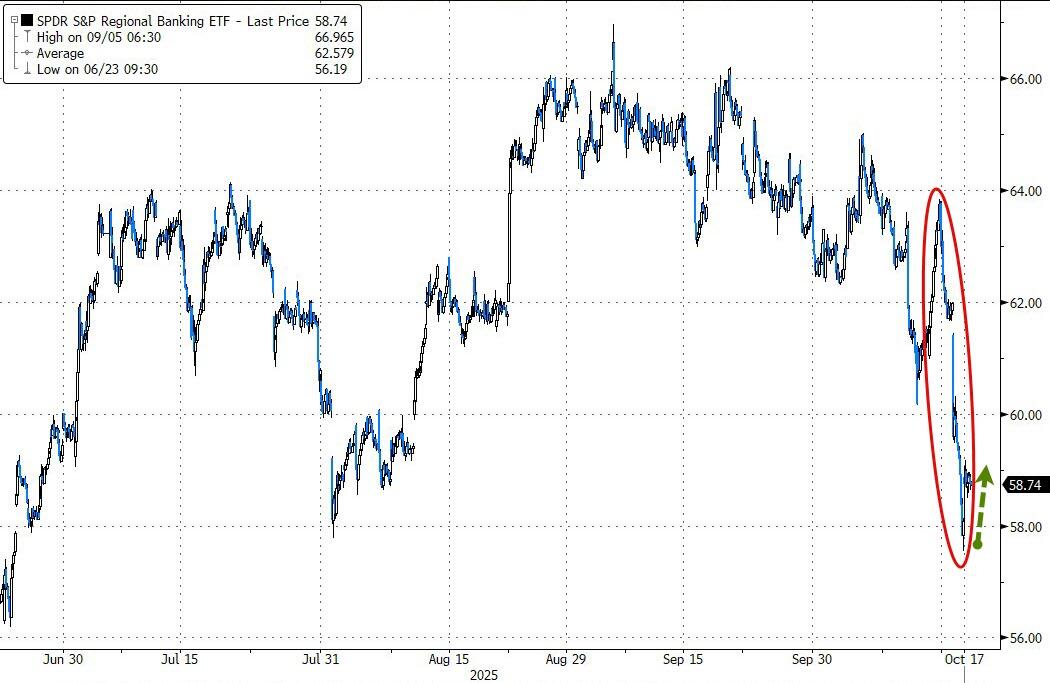
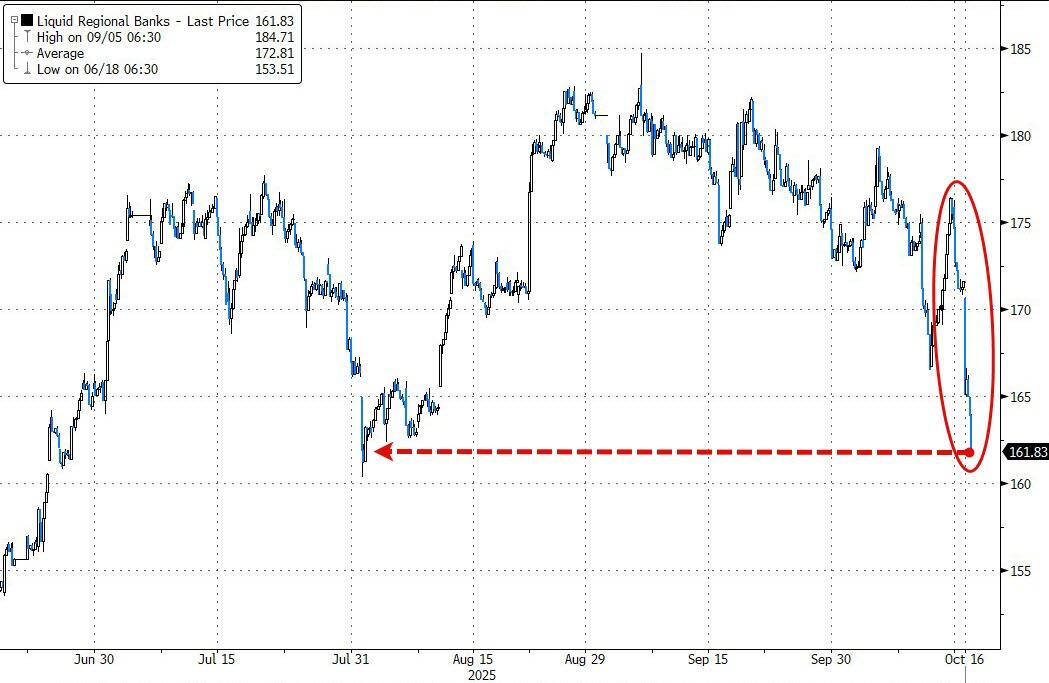
Regional bank names that led Thursday’s rout bounced back as Wall Street analysts defended the stocks and bet the bad-credit headlines were isolated.
Zions Bancorp, which plunged 13% yesterday after disclosing a $50 million loan charge-off tied to alleged fraud, gained about 2% today after receiving an upgrade. Western Alliance, down 11% on Thursday after revealing similar loan issues, also clawed back some early losses.
Investment bank Jefferies joined the rebound, rising roughly 3% after Oppenheimer raised its rating to outperform, just a day after the stock sank on concerns about exposure to bankrupt retailer First Brands.
For now, most in the market believe recent loan problems at banks like Zions and Western Alliance are one-off situations rather than evidence of a wider credit problem.
By the close, major indexes had stabilized, helped by a relatively quiet tape from the banking and private credit side.
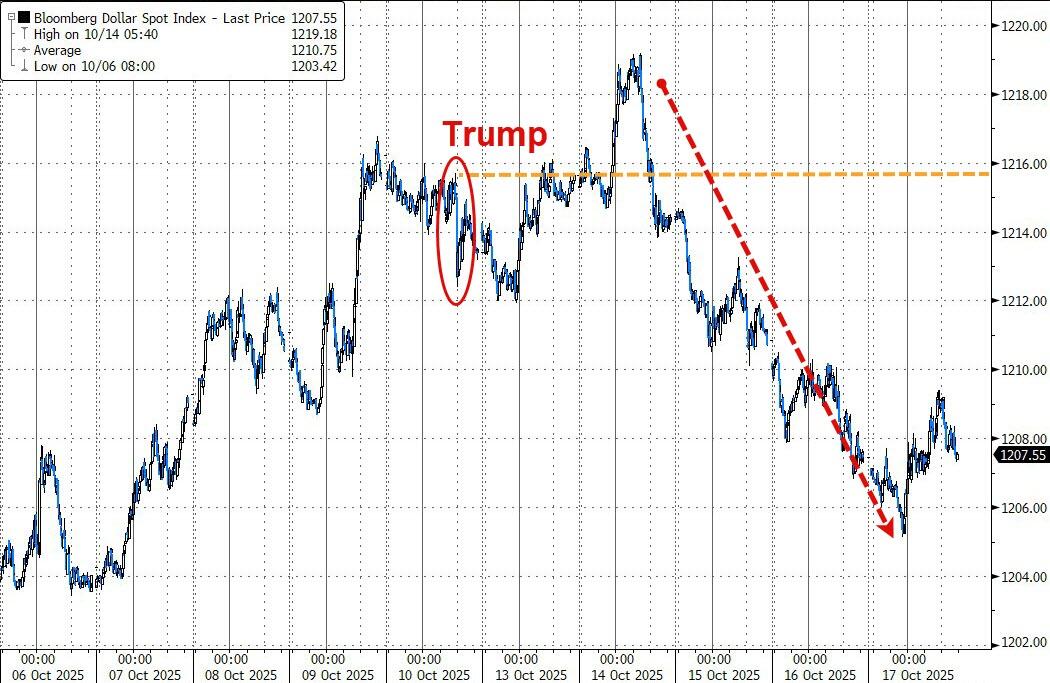
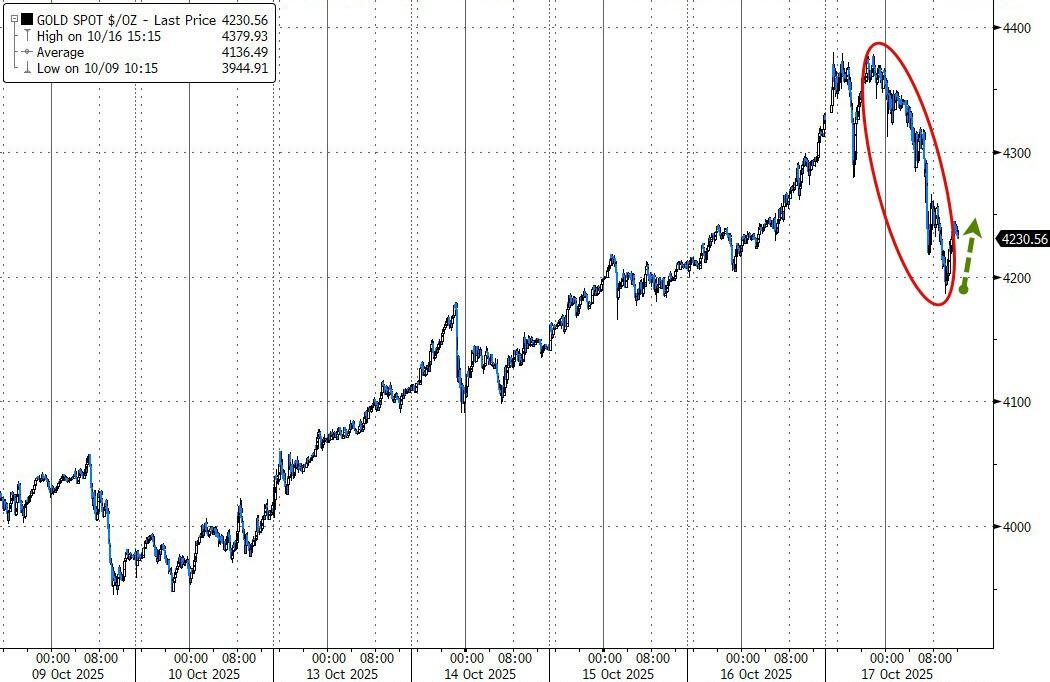
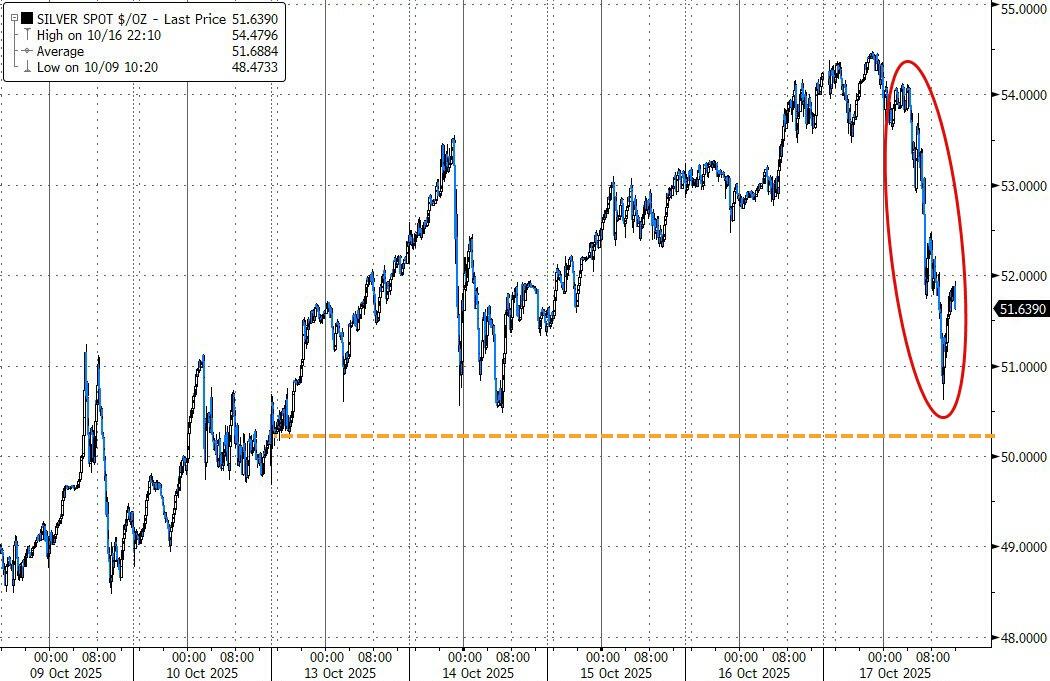
The dollar just notched its worst week in two months, while gold and silver finally cooled after a relentless run higher. Bitcoin slipped to around $107,000 after briefly hitting $104,000 earlier in the session.
With markets showing signs of steadiness heading into next week, will fresh earnings and inflation data help solidify this rebound, or will lingering credit worries creep back into focus?
ETF Data updated through Thursday, October 16, 2025
How to use this StatSheet:
Out of the 1,800+ ETFs out there, I only pick the ones that trade over $5 million per day (HV ETFs), so you don’t get stuck with a lemon that nobody wants to buy or sell.
Trend Tracking Indexes (TTIs)
These are the main indicators that tell you when to buy or sell Domestic and International ETFs (section 1 and 2). They do that by comparing their position to their long-term M/A (Moving Average). If they cross above, and stay there, it’s a green light to buy. If they fall below, and keep going, it’s a red light to sell. And to make sure you don’t lose your shirt if things go south, I also use a 12% trailing stop loss on all positions in these categories.
All other investment areas don’t have a TTI and should be traded based on the position of each ETF relative to its own trend line (%M/A). That’s why I call them “Selective Buy.” In other words, if an ETF goes above its own trend line, you can buy it. But don’t forget to use a trailing sell stop of 12%, or less if you’re feeling nervous.
If some of these words sound like Greek to you, please check out the Glossary of Terms and new subscriber information in section 9.
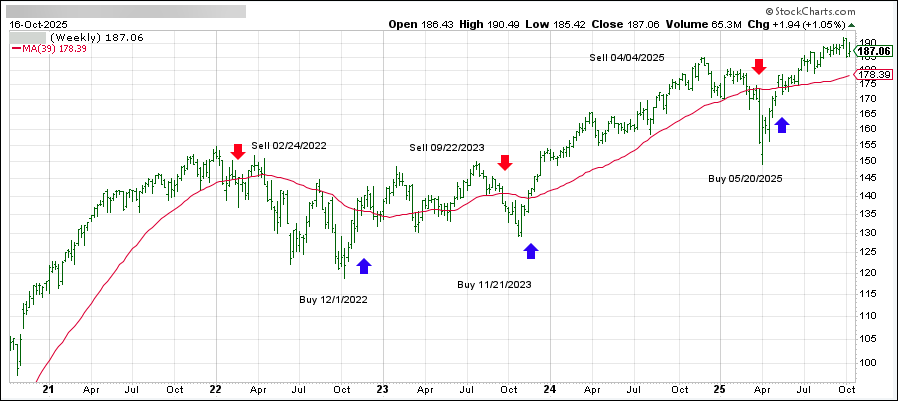
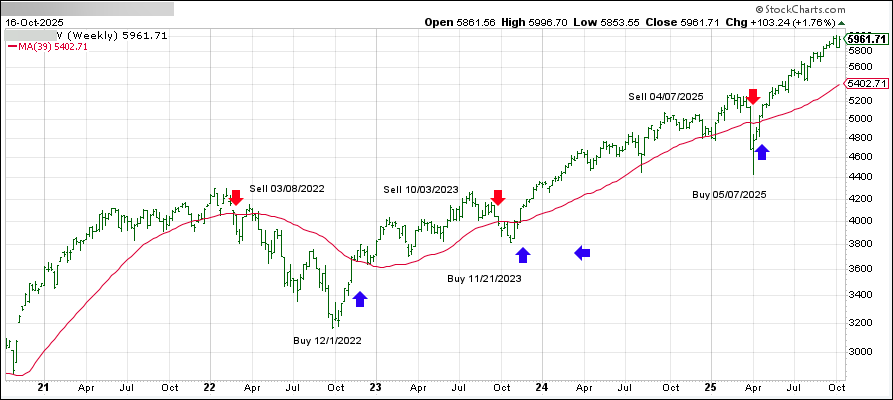
DOMESTIC EQUITY ETFs: BUY— effective 5/20/2025
Click on chart to enlarge
This is our main compass, the Domestic Trend Tracking Index (TTI-green line in the above chart). It has broken above its long-term trend line (red) by +5.00% and remains in “Buy” mode, with our new holdings being subject to our trailing sell stops.
The link below shows all High Volume (HV) Domestic Equity ETFs. They are ranked by M-Index, which is my secret sauce for measuring momentum. Prices in all linked tables below are updated through 10/16/2025, unless otherwise noted. Price data not yet available at publication is indicated with 00.00% or -100.00%. Please note that distributions are not included in the current momentum numbers.
If the TTI is above the trend line, you can use the tables in the link below to pick your winners:
This is our global guide, the International Trend Tracking Index (green). It has broken above its long-term trend line (red) by +10.87% and has been in “Buy” mode since 5/7/2025.
The list in the link below shows the High Volume (HV) International ETFs I track for you during a Buy cycle. They are also ranked by M-Index:
This is the mother of all lists, showing all ETFs I track and how they stack up against each other. The sorting order is by M-Index too. Momentum figures for all ETFs are not adjusted for dividends.
This is where you can find HV ETFs for specific countries or regions that I watch every week. Please note that the data in this table does not include adjustments due to distributions. Country funds can be wild beasts, so make sure you use a trailing stop loss (I use 10%) to protect yourself from nasty bites.
This is where you can diversify your portfolio by looking for different opportunities in various sectors of the market. The table of HV Sector ETFs in the following link covers a wide range of possibilities. The sorting order is by M-Index:
Here too, I recommend using a 10% trailing stop loss to limit your risk.
BOND & DIVIDEND ETFs: SELECTIVE BUY
If you like getting paid for holding ETFs, here’s a list of bond and dividend paying ETFs. But before you buy them, make sure you check their momentum figures first. Then you can visit your favorite financial web site to see their yield and other details.
Please note that the data in this table does not include adjustments due to distributions.
Please note that some of these funds try to beat the index they are tied to by a certain percentage. This can boost your returns, but it can also magnify your losses. So be careful and use a trailing sell stop (I suggest 10%) and be ready for some bumps along the way.
NEW SUBSCRIBER INFORMATION
To get a head start on more successful investing, please click on:
In case you missed it, you can download my latest e-book “How to beat the S&P 500…with the S&P 500,” here. If you are investing your 401k and must use mutual funds, I suggest you mainly stick with the S&P 500 as described in my book. Of course, you can always use the above tables to find sector or country ETFs that suit your taste and use the equivalent mutual funds as offered by your custodian.
Disclosure:
I must tell you that I, as well as my advisory clients, own some of the ETFs listed in the above table. Also, they are not meant to be specific investment recommendations for you, they just show which ETFs from my universe are doing well right now.
Stocks jumped out of the gate early on, fueled by upbeat bank earnings and optimistic forecasts from tech heavyweights that briefly pushed trade-war worries to the back burner.
Big Tech helped keep the early rally alive—Nvidia gained 1.2%, while Broadcom rose another 2% after Taiwan Semiconductor lifted its 2025 revenue outlook to mid-30% growth and reaffirmed plans for $42 billion in capital spending before year-end.
Momentum from earlier in the week carried over, thanks to strong reports from Goldman Sachs, Wells Fargo, and other big banks, which bolstered confidence in corporate fundamentals.
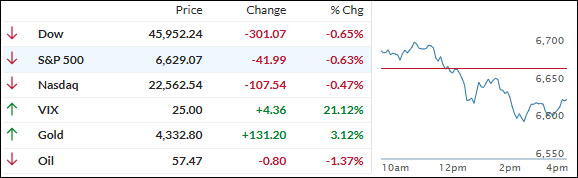
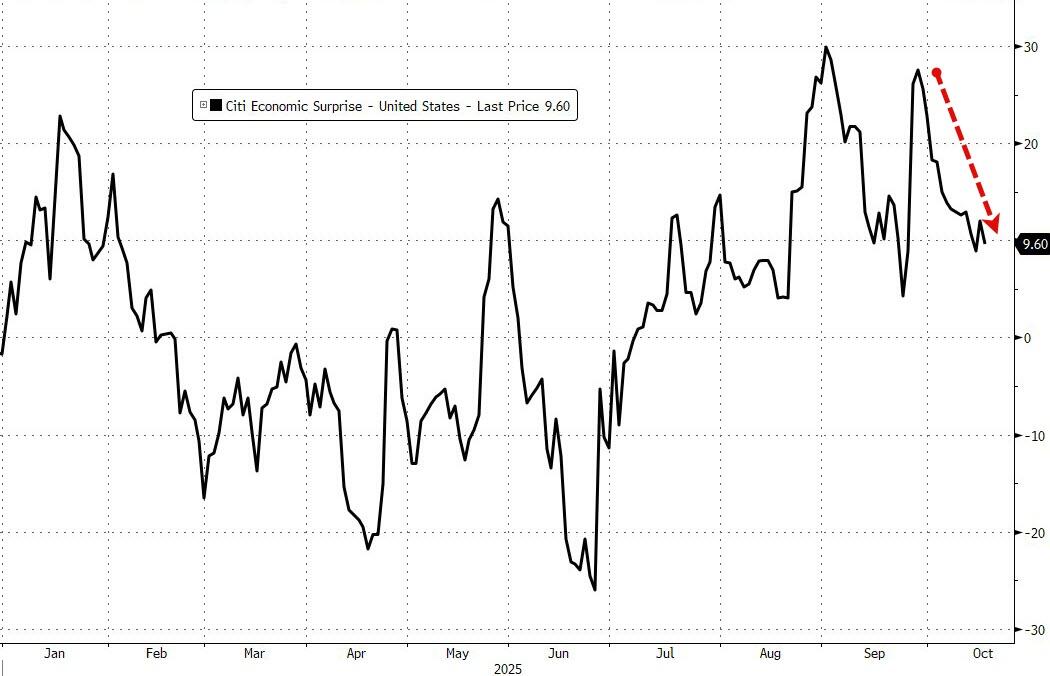
But as we’ve seen repeatedly this month, the early optimism didn’t last. Weak macro data, hawkish Fed comments, and fresh concerns over loan troubles at regional banks sapped enthusiasm by midday, with the major indexes turning south and surrendering Wednesday’s gains.
The latest hit to sentiment came from two regional lenders—Zions and Western Alliance—which revealed potential loan irregularities involving alleged fraud. That renewed fears about credit quality and financial stability, sparking a flight to safety.
Bonds rallied, driving the 10-year Treasury yield below 4% for the first time in a year. The dollar slipped, gold soared 3.2% to another record, and silver climbed 1.7% to crack the $54 level. Bitcoin, meanwhile, slid to $107,000 before finding some support.
With the market now juggling upbeat earnings, banking worries, and shifting Fed signals, is this just a healthy reset—or the start of deeper caution setting in before year-end?
The bulls wasted no time taking charge this morning, pushing stocks higher as a string of upbeat earnings easily outweighed any anxiety from escalating trade tensions with China.
Big banks fueled the rally—Bank of America jumped 4% after smashing earnings forecasts thanks to a surge in investment banking revenue, and Morgan Stanley soared 6% on its own blowout results. Those strong showings followed Tuesday’s solid reports from Goldman Sachs and Wells Fargo, keeping the positive momentum rolling.
That said, it looks to me like stocks could drift sideways from here, especially if the trade war rumbles on and the ongoing government shutdown continues to weigh on sentiment.
Yesterday’s session was a wild ride—the S&P 500 nearly staged a comeback but faded late after President Trump threatened a cooking oil embargo against China, hitting back for Beijing’s decision to stop buying U.S. soybeans.
Today, midday jitters briefly took markets into the red, but by the close today, bullish spirits returned, leaving only the Dow unable to keep pace.
Once again, the broad market outperformed the big-name “Mag 7” stocks, while bond yields crept higher, and the 10-year Treasury bounced off the 4% mark.
Gold kept smashing records, up 1.7% for the day, with silver also climbing 3.3% and just barely missing a fresh high. Bitcoin slipped to $111,000, and the dollar pulled back to one-week lows.
Is this just a quick burst of volatility as earnings compete with trade headlines—or are we in for more headline-driven swings as the drama unfolds?
